
I previously produced a chart like this one below. There I showed the US Federal Reserve Liabilities normalised to 1914 dollars. This has the effect of visually amplifying the massive currency creation around the World War I and World War II. It does not change anything but puts them all into the same dollar value terms and so we are comparing ‘apples with apples’. I also showed that as those wars ended the currency tightening brought the Fed’s balance sheet liabilities back to a background trend line (1) in Fig. 1.
After 2003 we saw a massive uptick in currency creation with QEs 1 through 3 and then again with the COVID pandemic QE in 2020. Now 6 months has past and we need to look again at these liabilities. In Fig. 1 I have added to the plot. You’ll notice a short blue extension of the data from June 2023 to December 2023.

Source: Liabilities data for 1916–2023 from the Board of Governors of the Federal Reserve System, statistical release H.4.1, Factors Affecting Reserve Balances of Depository Institutions and Condition Statement of Federal Reserve Banks, via FRED; and M2 money supply data for 1959–2023 from the Board of Governors of the Federal Reserve System, statistical release H.6, Money Stock Measures, via FRED. Note: The solid trend line (1) is a curve fit to the data between 1965 and 2003. The solid trend line (2) is a double exponential curve fit to the data after 2003. The two world wars are indicated by arrows pointing to the pink regions. Recessions are indicated by sepia-colored strips. QE is Quantitative Easing (credit creation). QT is Quantitative Tightening (credit contraction).
If we zoom into Fig. 1 and use only data above 2003 on a linear scale we get the following Fig. 2. This is still normalised liabilities. Curve (2) is the same exponential curve fit above 2003. The QE 2 and 3 just touch the line. At the time of the QE bail out of the failing regional banks (SVB etc) in March 2023 the liabilities comes back to the trend line. Since the bank bail outs the Fed has been tightening (QT).

On this chart (Fig.2) I have shown when the 2019 repocalypse – the repo market crisis – occurred. The repo market is the overnight interbank lending known as repurchase agreements. The Fed had been tightening, which is easily seen in the above plot, just before the vertical dashed line in 2019.
The Fed, immediately after this long, dark day last December [2018], slammed the brakes on its interest-rate increases and promised it would stop tightening sooner than it had originally said it would.
Repocalypse: The Second Coming
But by the end of 2019 the Fed liabilities had dropped 36% below the exponential trend line (2).
To study this more closely I have plotted the same data but this time unnormalized and show it from 2014 to the present time in Figure 3.
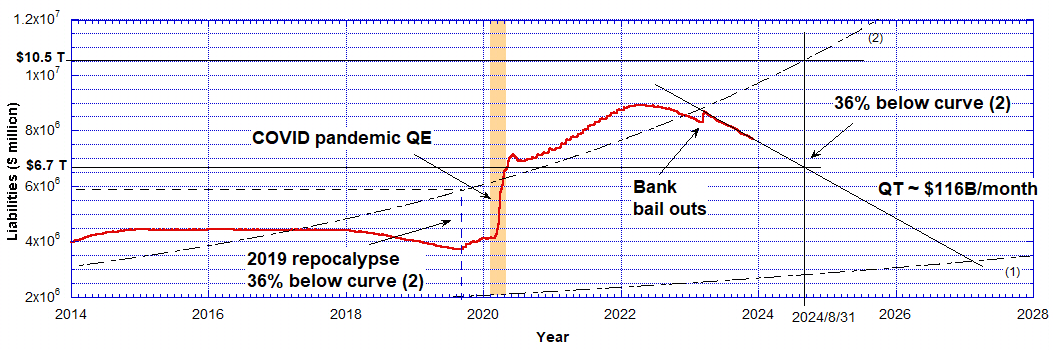
Currently the Fed is tightening at a linear QT rate of about $116 B/month as indicated. At this rate, assuming it continues, the liabilities will reach the point 36% below the exponential trend line (2) on August 31, 2024 as indicated. Of course there is no guarantee that this trend will continue. But if it does get there, it means that to increase the liabilities from $6.7 Trillion on August 31, 2024 up to the trend line (2) $3.8 Trillion of new credit must be injected. This would bring the total liabilities up to $10.5 Trillion.
During the 2020 COVID pandemic QE the Fed injected $3 Trillion and overshot the trend line (2) by $800 Billion. That is a 27% overshoot. If they do the same in late 2024 and overshoot by 27% that means they will inject $5.2 Trillion, assuming they do it at the end of August 2024. If it is later they’ll need to inject even more as the exponential trend line (2) is exponentially rising. This means if they wait another 8 months they will need to inject more than $5 Trillion to re-inflate the economy in very short order.
On this plot (Fig. 3) I have also shown the intersection point were the Fed liabilities fall back to the background trend line (1) established from 1965-2003 data. To reach this the US would need to end all wars and close off all the easy credit issuance. But I suspect a financial catastrophe would occur long before they got to February 2027 which the current linear QT would bring the liabilities to, if continued somehow.
At best we have only 8 months before another financial crisis and massive QE when the Fed pivots and cranks up the printing presses again. But it could come much sooner than that and they may choose to pivot early in 2024 long before we get to the 36% reduction figure. That would mean less ‘money printing’. And another war would be a good excuse to ‘start the presses’.
Published on Mises.org under Power & Market Blog
*I would like to thank Rafi Farber of the End Game Investor for his valuable advice.
Recommended Reading
Book: Apocalypse Now: On the Revelation of Jesus Christ
Follow me
- Telegram.org: @GideonHartnett
- Facebook: Gideon Hartnett
- X (Twitter): gideon195203
To be notified by email put your email address in the box at the bottom of your screen. You’ll get an email each time we publish a new article.
Support my site

Click this image to make a secure Donation (Stripe) !


One response to “When Will the Fed Pivot?”
[…] fiecare fază a QE a fost implementată. Dar acum suntem din nou în QT și ca și cu Repocalypse Fed trebuie să pivoteze în curândscădeți ratele și porniți din nou […]
LikeLike