Gold is money! Everything else is just credit, derivatives of gold. Just above gold on Exeter’s inverted pyramid is the US Federal Reserve note which is the global reserve currency. Gold is bought and sold in US dollars, which affects all other currencies through the forex exchange rates. Right now the Australian dollar denominated gold price seems to be signalling a massive ‘moon shot’.
Previously I have analysed the gold price in US dollars and stripped out the effects of dollar devaluation using he M2 currency supply. Here I take a look at the price of a troy oz of gold priced in Australian dollars over the period 1971 to 2025. 1971 was the year the US closed the gold window and the price of gold rose dramatically after that.

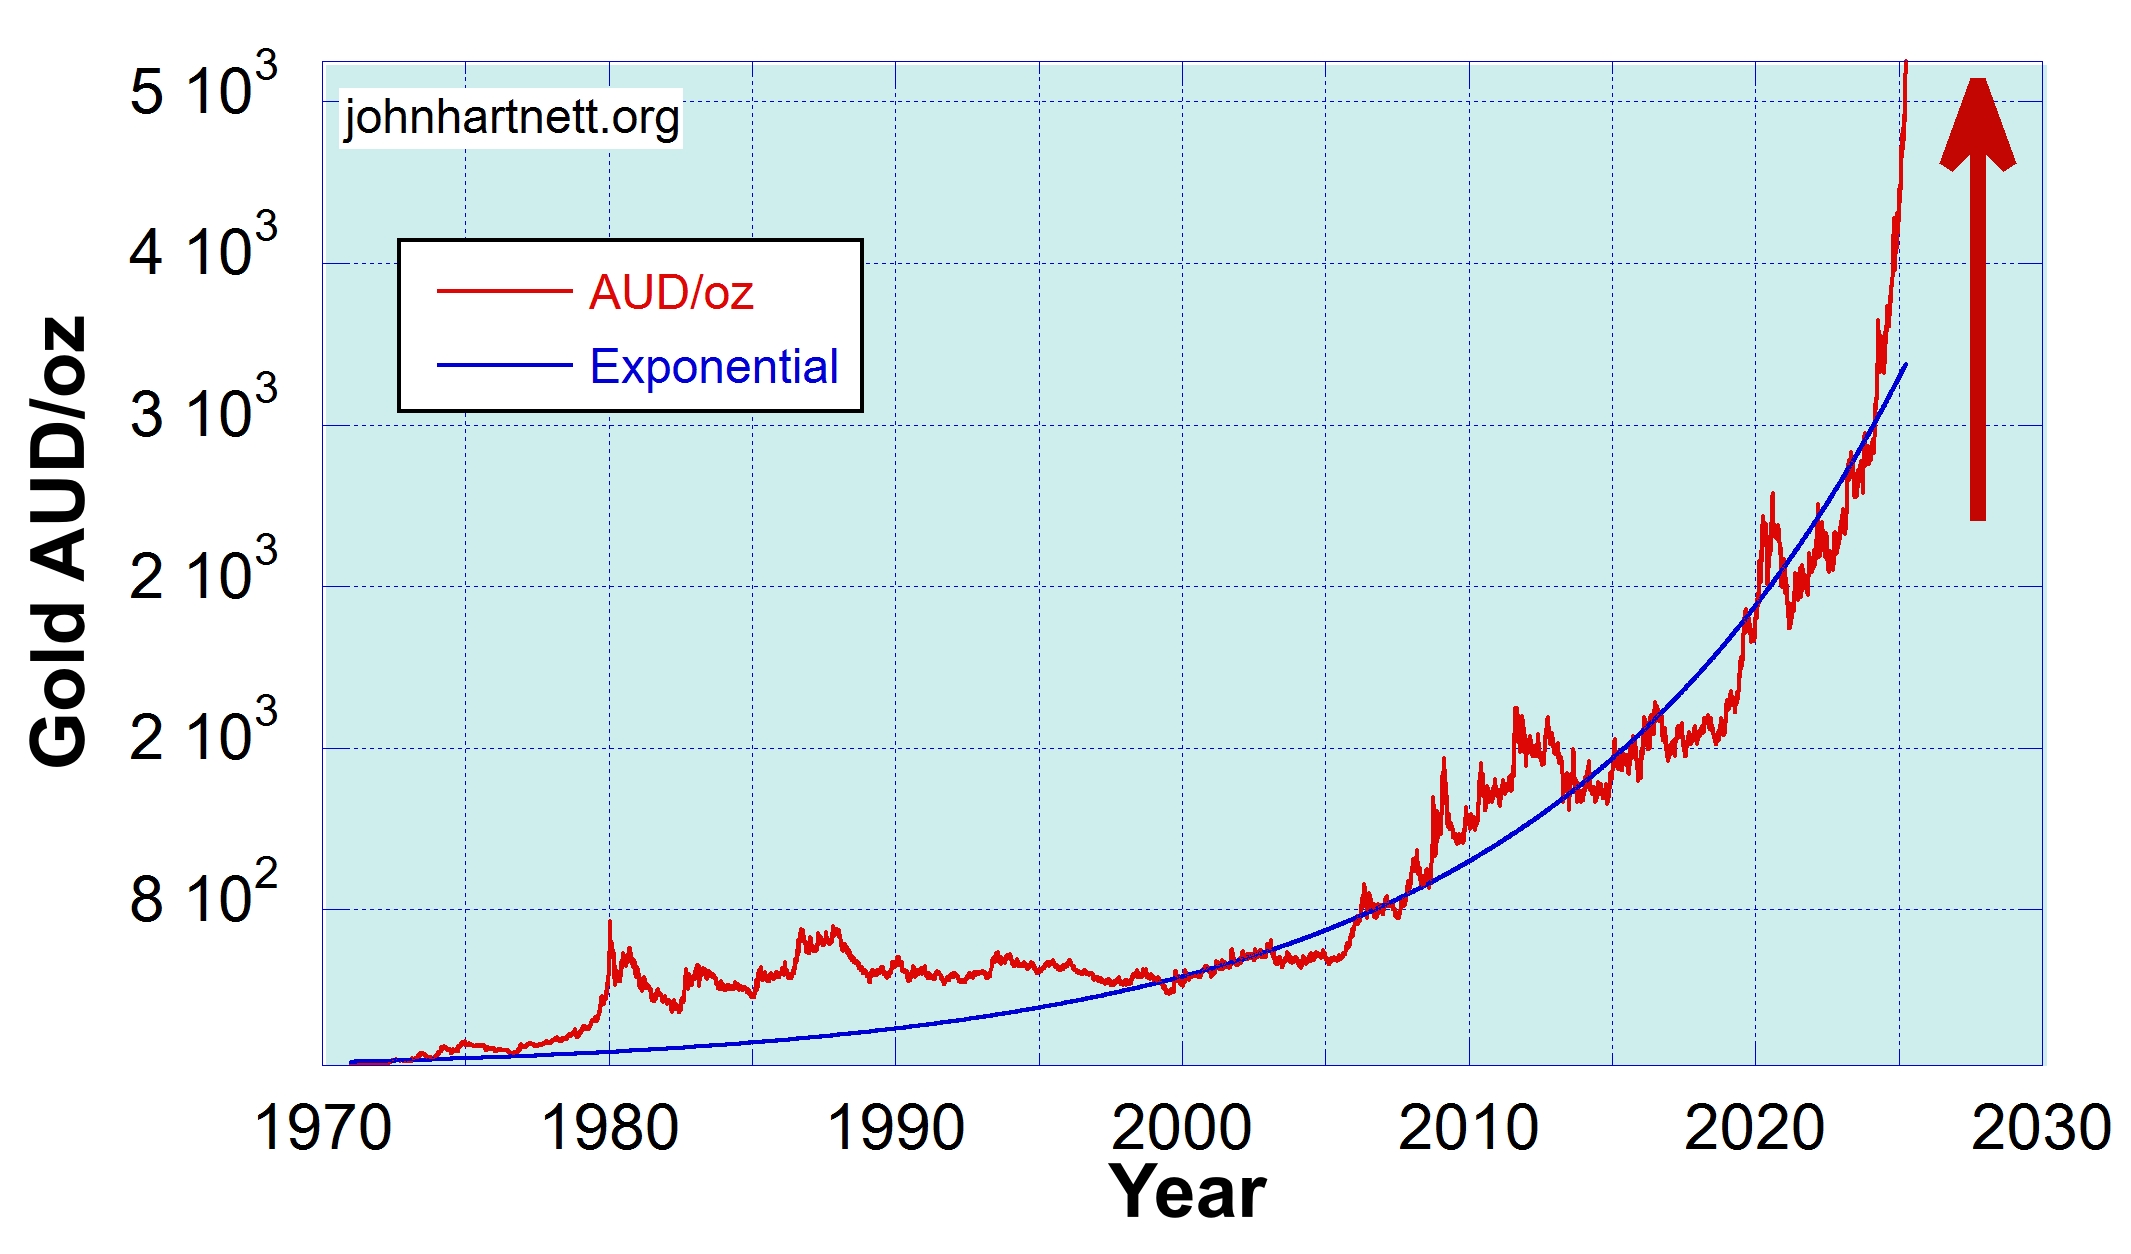
To the raw gold price in AUD/oz (red) I fitted by least squares analysis a single exponential curve with only two free parameters over the range 2000 to 2025. The resulting curve (black) is shown in Chart 1 for the whole range from 1971 to 2025. But between 1971 and 2000 the data was not used for the fit. The reason for this is apparent in Chart 2.

Chart 2 shows the same raw data — the gold price in AUD/oz (red) — as shown in Chart 1, but this time the vertical axis is logarithmic. On a log scale an exponential is a straight line. This is apparent between 2000 and 2024 with some fluctuations. After March 2024 the gold price (red) departs from the exponential curve (black).
In 1971 the black fitted curve does not quite meet the gold price but it is not far off. It meets it in 1972. From 1972 the gold price rose to peak in 1980 after which it ‘travelled’ sideways until 2000.
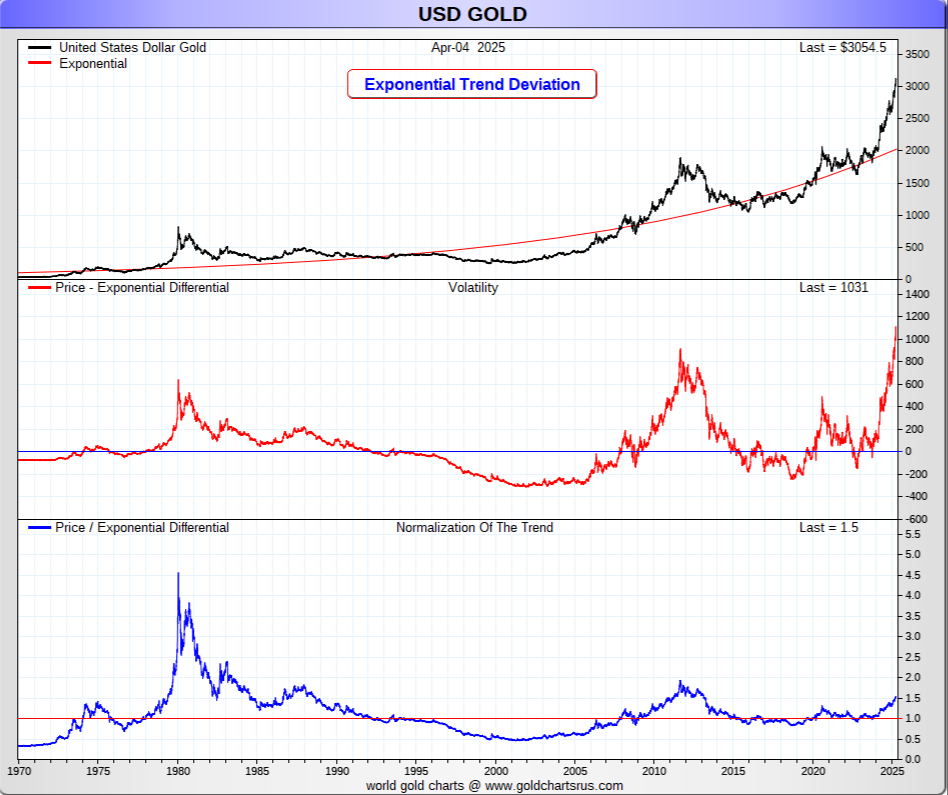
Here I use the exponential curve fit (black) to strip out the effects of dollar deflation by subtracting the (black) exponential curve from the (red) raw nominal price data. The result is shown in Chart 3.

This is a way of highlighting the changes (volatility) in the price of gold (AUD/oz) in real terms where dollar devaluation effects are removed. This is a differential curve, the deviation from a certain price. For example, the price of gold was $33.88 on 4 January 1971. Add that price to this red curve data in Chart 3 and you have the uninflated price of gold in 1971 AUDs.
In real terms there were three periods where the real price of gold fell as shown when it was below zero on Chart 3. Most interestingly this Chart highlights past historical periods of real price increases, including 1980, the GFC in 2008, 2011 and the Pandemic in 2020.
Finally it is signalling a massive bull market which started in March 2024 and looks like it is almost going vertical. This is the best ‘moon shot’ data I have ever seen.
My hypothesis here is that the exponential fit to the raw data is a proxy for the expansion of the currency supply. So why not use that to determine the effect on the gold price historically?
Theoretically if the latter is a true proxy for currency devaluation and if the nominal price of gold only changes because of that then we should get a constant curve equal to unity when we divide the gold price by the exponential curve fit. Chart 4 shows the gold price normalised by the exponential curve fit.

Between 2000 and 2024 the result hugs around the unity line (red dashed curve) but between 1972 and 2000 there is a major departure as high as 7.8x in 1980.
So if you choose 1972 when this normalization curve is unity and multiply it by the price of gold then, equal to about $37 AUD, you’d get the real price of gold over this range in constant value AUD dollar terms.
Around the beginning of 2024 the normalization curve was also unity. This means the true value of gold had not changed relative to 1972. But during the 1980s and 1990s the true value of gold was significantly greater than it is now.
Chart 3 must be signalling that a moon shot is already in progress. Is this the beginning of the End Game, von Mises’ Crack-Up Boom? We shall see shortly. Get prepared!
Related Reading
- The Trump Effect | Gold and Silver Price Predictions Updated
- Gold and Silver Real, Uninflated Prices Break Out | How High Will They Go?
- Update: Gold and Silver Prices Above Predictions
- The US National Debt Predicts Gold and Silver Price Break Outs
- Is the Gold-to-Silver Ratio Predicting Another Great Depression?
Free Subscribers
Subscribe to our Newsletters as a Free Subscriber and be notified by email. Just put your email address in the box at the bottom of your screen.
You’ll get an email each time we publish a new article. It is quick and easy to do and totally free. You only need do it once.
Premium Subscribers
Subscribe to our Newsletters as a Premium Subscribers at $5 USD/month or $30 USD/year (you choose).
Paid Premium Subscribers will get exclusive access to certain content I publish, which I expect to be about 4 exclusive posts per month. That will only cost you a cup of coffee per month.
Also you’ll get access to download, for free, a PDF of my book Apocalypse Now. You can download it from a Premium members only post here.
And now you’ll get exclusive access to the chapters (in their initial draft form) to my new book with working title “The Physics of Creation”; plus eventually a PDF of the final compiled book.
This is how you can support my work. I have been publishing this website for 10 years now and up to 2024 I never asked for any support.
Press the button “Premium” on the front page to find a list of Premium content. Over time that list will grow. Thanks so much to all supporters.
At a minimum, please join as a Free Subscriber. It’ll cost you nothing. It may also help me beat the shadow banning of some posts.