

On the internet there is a lot of discussion, speculation and even dire predictions about the Earth’s magnetic field. Some speak of immanent pole flips and others of chaos as the magnetic North and South migrate farther from the geomagnetic poles. What do we know and what does the future look like?
What follows is an extension of my model described for the Earth’s magnetic field in Fig. 2 of A Brief History of the Earth’s Magnetic Field. Here, in Fig. 1, I extrapolate into the future about 500 years and hence predict future events. Please keep in mind the possibility of some unknown unknowns and hence the precarious nature of extrapolation like this.
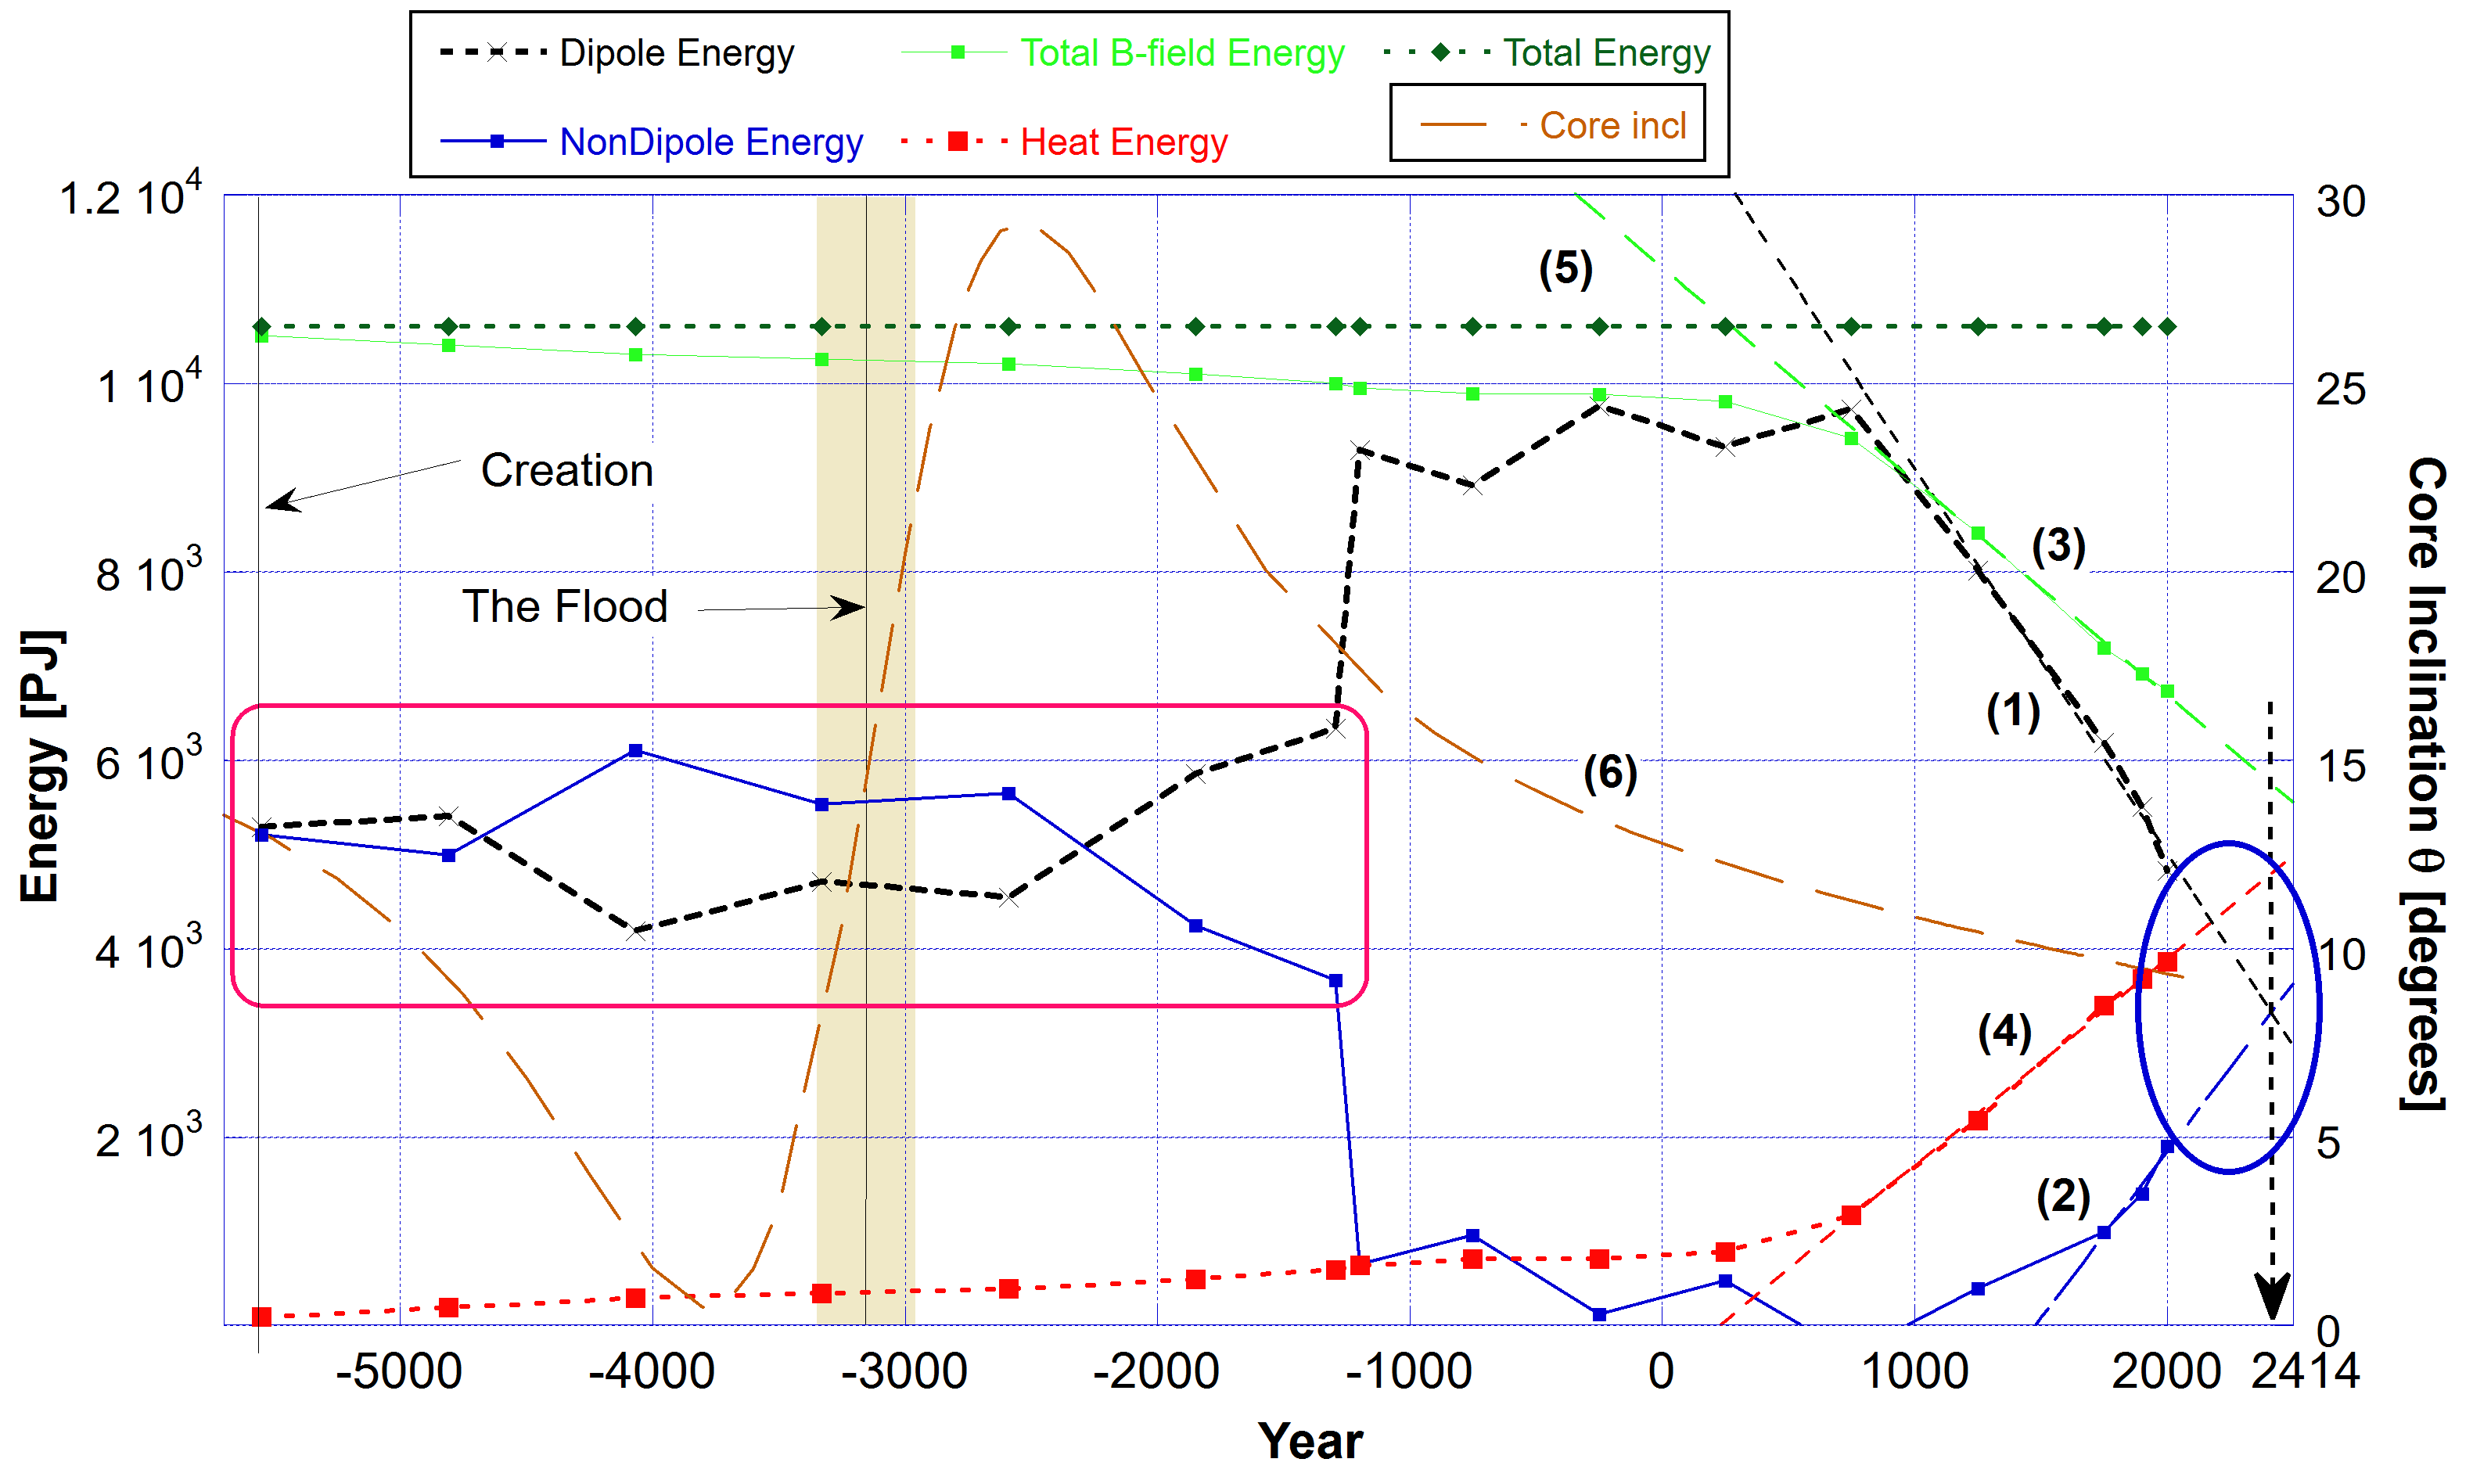
For the energies shown in Fig. 1 I made the very reasonable assumption that energy is conserved in the Earth’s magnetic field. Curve (5) illustrates this. All energy in the magnetic modes plus any heat generated must equal the Total Energy (5), dark green. I also assumed from the moment of creation, the second law of thermodynamics is operating and heat is generated by ohmic decay of the circulating current in the core. This heat accumulates according to curve (4) (red, Heat Energy).
Curve (1) (dashed black, Dipole Energy) is connected to recent measurements of the dipole near 2000 as calculated by Dr Russ Humphreys. That curve then gives a history of the energy in the Dipole for the whole period shown. Though the dates may not be well represented that curve is based on real measured data.
By knowing that the Total B-field Energy in the magnetic field (both Dipole (1) black, and Non-Dipole (2) blue, modes) must decay I modelled such a dependence (curve (3), light green). That light green curve (3) agrees with Humphreys’ calculated value for Total Energy in the magnetic B-field near 2000. By adding to that the Heat Energy (4) generated you get the the Total Energy, dark green curve (5).
The Non-Dipole Energy calculation agrees also with Humphreys’ calculated energy (blue curve (2) near 2000). The energy in this mode was not measured except near 2000 but the gradient matches near 2000. The gradients also match Humphreys data for the Dipole Energy and the Total Energy in the B-field near 2000.
You’ll also notice that the big changes in the core inclination axis were during the first 5,000 years (pink rectangle) when the energies in the Dipole and Non-Dipole fields were nearly equal and oscillating around 50% each. Heat energy from the decaying total B-field was slowly building but still low.
For the period 2000 to 2500 I have extrapolated the Dipole Energy (1), the Non-Dipole Energy (2), the Total B-field Energy (3) and the Heat Energy (4) all of which fit linear expressions very well with curve fit R > 0.99 in all cases. For the short range of Humphreys data (1990-2000) an exponential curve will be linear when the range of measurements are a small fraction of the doubling time (the time constant). Here linear fits work very well for at least the last 300 to 500 years.
The blue oval indicates the area of interest. The decreasing Dipole Energy and the increasing Non-Dipole Energy will become equal in the year 2414 when both contain 29% of the total energy. The remaining energy will be in the heat generated from the decaying fields at 42% of the total.
In the year 2179 the Dipole Energy and the Heat Energy will be equal with 37.5% each of the total. The remain 25% will be in the Non-Dipole modes at that time. Thus the Total Energy in the magnetic B-field (the sum of the Dipole and Non-Dipole modes) would be down to 62.5% as compared to 100% at creation.
If these linear trends continue as indicated, by 2414 the energy in the Dipole and Non-Dipole modes will be equal. This indicates a lot of chaos in the circulating currents in the liquid outer core. Pole flips are on the cards. Also the Total Energy in the magnetic B-field (the sum of the Dipole and Non-Dipole modes) would be down to 58% as compared to 100% at creation.
The decaying Dipole Energy would be completely zero by 3227 if the trend continued. However I believe long before then the Creator must intervene to regenerate the Total magnetic field strength if He is going to preserve the Earth forever, which I believe He will.
Related Reading
- A Brief History of the Earth’s Magnetic Field
- Major Changes in Earth’s Magnetic Dipole Since Creation
- Obliquity of Earth’s Axis | How Has It Changed?
- Can We Know the Year of Noah’s Flood?
- Earth’s Magnetic Field: A Shield by Design
- Can Earth’s Magnetic Field Survive for Billions of Years?
- The Mysterious Weakening of Earth’s Magnetic Field Explained
- Earth | A Sphere By Design
- The Sustaining Power of the Creator
- The Physics of Creation | Day 1
- The Physics of Creation | Day 2
- The Physics of Creation | Day 3
- The Physics of Creation | Day 4
- The Physics of the Global Flood
- My Book ‘Physics of Creation’
Free Subscribers
Subscribe to our Newsletters as a Free Subscriber and be notified by email. Just put your email address in the box at the bottom of your screen.
You’ll get an email each time we publish a new article. It is quick and easy to do and totally free. You only need do it once.
Premium Subscribers
Subscribe to our Newsletters as a Premium Subscribers at $5 USD/month or $30 USD/year (you choose).
Paid Premium Subscribers will get exclusive access to certain content I publish. That will only cost you a cup of coffee per month.
This is how you can support my work. I have been publishing this website for 10 years now and up to 2024 I never asked for any support.
Press the button “Premium” on the front page to find a list of Premium content. Thanks so much to all supporters.
At a minimum, please join as a Free Subscriber. It’ll cost you nothing. It may also help me beat the shadow banning of some posts.


Leave a comment