

The concept of decreasing human life spans after the Flood is considered by analogy to a quality factor that one observes in physical systems. It is found that the concept is not inconsistent with what we observe from the decreasing life spans of the Patriarchs listed in Genesis.
In physics we define the quality factor (or Q-factor) of a system using the time it takes for it to dissipate 1/e of its energy. If we then look at human life spans in terms of a quality factor we would all have to agree that length of life or age at death defines a sort of a quality factor.
One researcher examined entropy of living systems and concluded that essentially we die because we come into thermal equilibrium with our environment at senile old age.1 This is where we can no longer generate enough heat to sustain life in the body and we die. So to live a long time means we have some sort of higher quality factor and it takes longer for the state to arrive where the cells in the body can no longer generate enough heat. This is of course what entropy is all about. Living things are complex systems and while functioning properly are highly complex low entropy systems.
This concept is not incompatible with the ideas of genetic entropy, nicely described by John Sanford.2 In that case death comes sooner in a population due to the accumulation of genetic damage. Considering only senile death, it is conceivable that as the number of generations an organism (humans in this case) passes its genes onto the next generation the genes within the surviving population accumulate genetic defects (mutations) and this results in an increase in genetic entropy. Hence in the individuals in the population death progressively comes sooner as they are not able to sustain life as long as their parent before them.
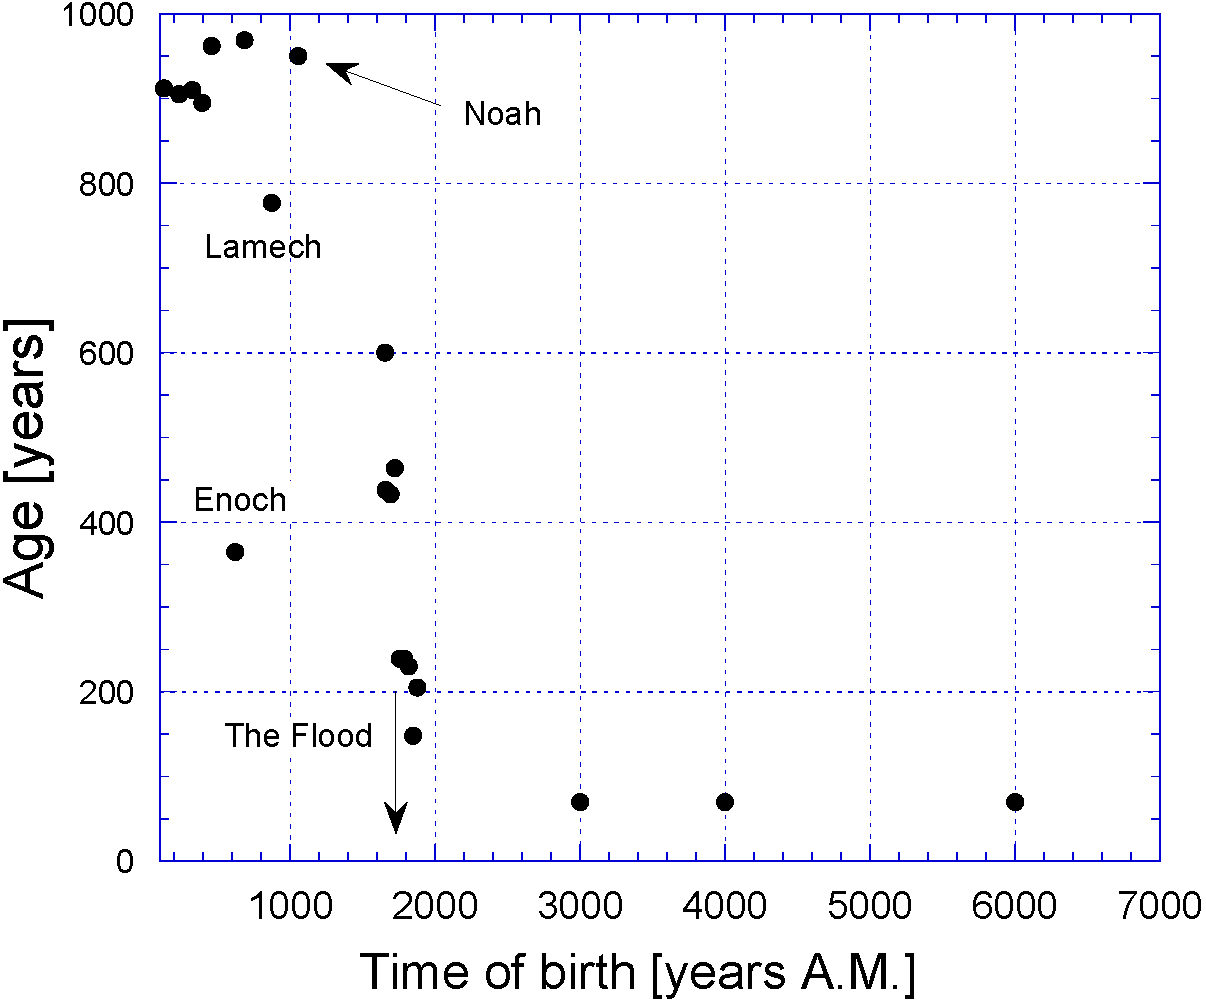
In light of the above, if we look at the ages of the Patriarchs listed in Genesis, chapters 5 and 11, we may get a new perspective. In Figure 1 I show their ages, plotted at the time of their birth, both before and after the Flood. The Flood is indicated in the year A.M. 1656.3 Also I have included 3 additional points at A.M. 3000, 4000 and 6000. These indicate, respectively, roughly the time of David, of Christ and the present day. The age indicated at each point is 70, the three score and ten years spoken of by Moses (or Ps 90:10).
At this point let us define the quality factor for human life in analogy to that we do in a solid state system in physics. In a crystal we look at the energy dissipated from the system and the Q-factor is defined in terms of the total losses in the system. That is
Q = 1/L, (1)
where L represents the losses. In the case of human (or any) life the losses represent the energy lost from the system integrated over some finite period of time. This definition is in the context of senile death, not due to accident, disease or being taken by God meaning not seeing an earthly death.
From Figure 1 we can immediately ignore Enoch because he did not die in the normal way. Then let us now plot the reciprocal age of the patriarchs, which represents a measure of the losses in their bodily systems (the reciprocal of their Q-factors) and the result is shown in Fig. 2.
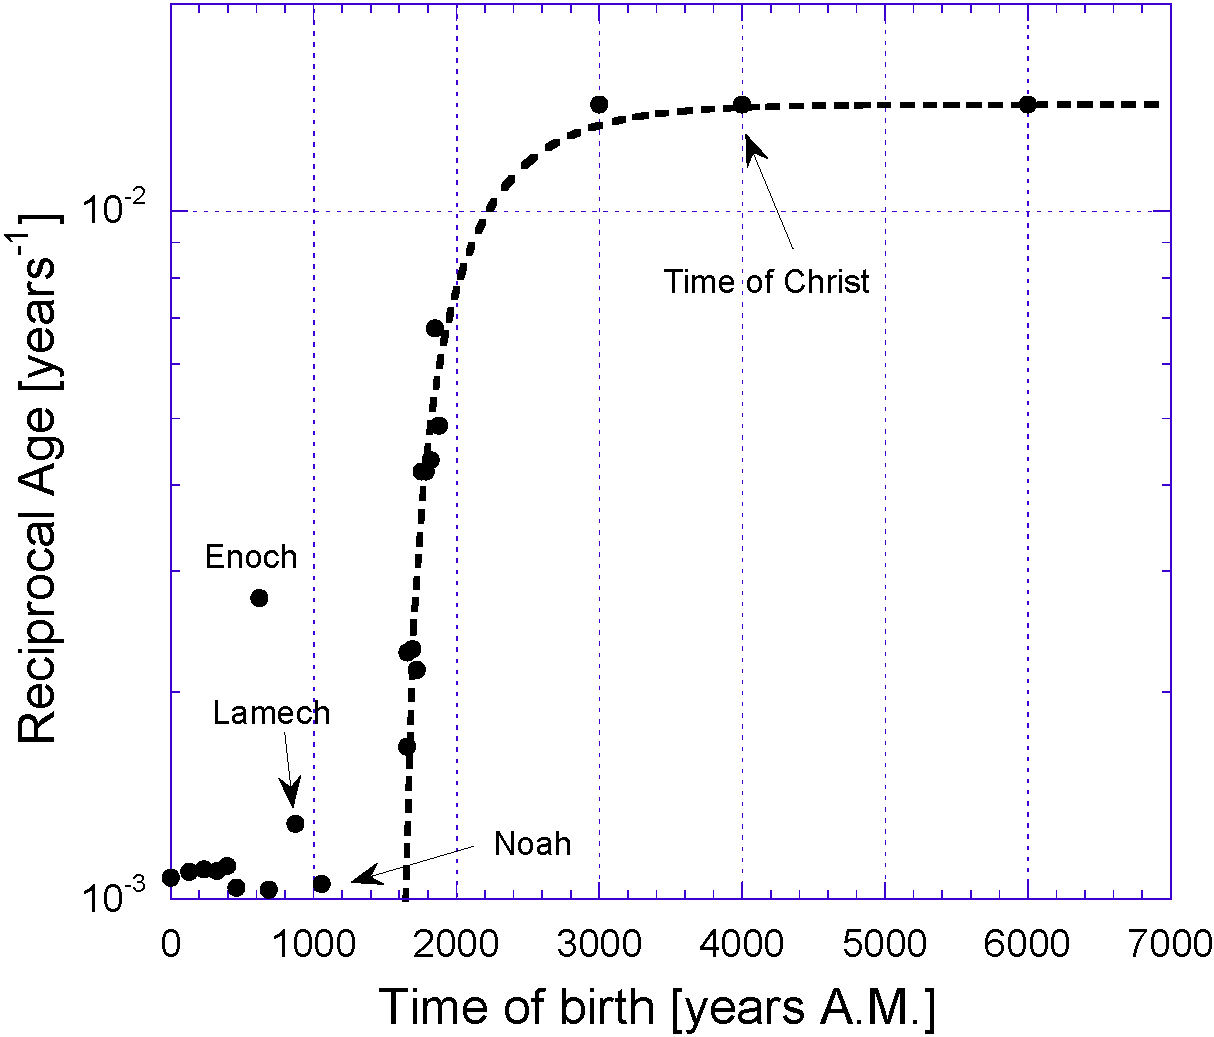
You will notice of course a high quality factor means low loss of energy per unit time. So the pre-Flood patriarchs have high Q-factors and low losses; post-Flood it is a different story.
To the data I have fitted the best fit curve4 given by
L(t)= 0.014286 – 0.312344.exp(-t/τ) , (2)
where L(t), a function of time in years, is the reciprocal ages of the patriarchs. All values were determined as free parameters from the fit. And the time constant τ = 518.06 ± 3.44 years means the losses in the human system increased by a factor e (the natural base ≈ 2.71828) over that time period.
Therefore using equations (1) and (2) you can calculate the expected age of anyone born at any epoch after the Flood, in years A.M..
In order to take into account the pre-Flood world we can see from Fig. 2 that they have losses also, though much smaller that the post Flood worldlings. Hence their very long ages. Excluding Enoch and Lamech they average 935 years. If we use this as a constant loss we can draw a horizontal line at 1.07 × 10⁻³ in Fig. 2, which has been reproduced as Fig. 3 on an extended log-log scale.
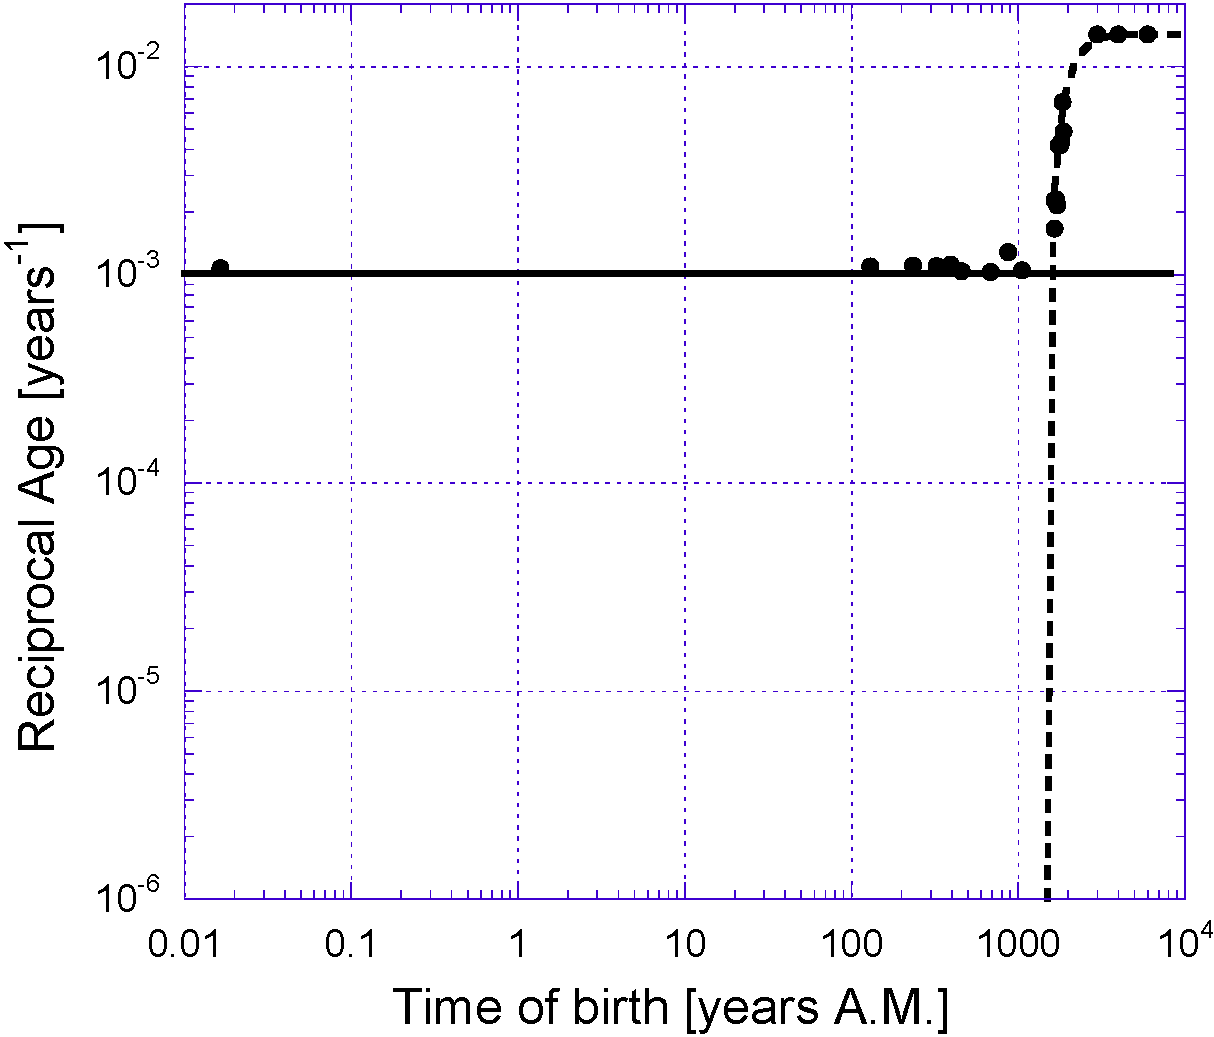
Figure 3 shows the same data (excluding Enoch) where the fit curve (2) shown as the broken line becomes almost vertical as it approaches zero. I speculate, that during the period of time before the Flood and after the Curse, God sustained the decay processes at a constant level in the pre-Flood worldlings bodies so that they lived a long time but not millions of years as the reciprocal of the broken curve in Fig. 3 would suggest.
This means God added additional losses after the Curse so that the body system losses were held roughly at a constant until the Flood. This is another way of saying that even though genetic entropy was already increasing after the Curse the losses from that were very small in comparison to some predetermined level that God had set in the antediluvian world. These larger yet constant losses could have been due to a genetic mechanism (as yet unidentified) but extremely small by comparison to the currently very large and ever-increasing losses.
Incorporating this hypothesis we must add the pre-Flood loss line (solid horizontal line) to the post-Flood loss curve (broken curve) to get the corrected equation (now piecewise).
L(t) = 0.00107 for t < to, (3a)
L(t) = 0.014286 – 0.312344.exp(-t/τ) for t > to, (3b)
where to represents the time, t, where the two curves cross in Fig. 3. It is a piecewise curve that incorporates the worldling age losses, before and after some critical time (to) when a significant event occurred.
By solving equations (3a) and (3b) for t = to we get A.M. 1638 ± 10 (statistical 1σ errors). This is in pretty good agreement with the date for the Flood from the Masoretic Text used by modern Hebrew Bibles.
So my speculation here would be that at some point near the time of the Flood, or at God’s call to Noah to build the ark, a decay process overtook in the bodies of the inhabitants of the world then and the case is continuing the same now. This decay process started in the Curse but due to God’s sustaining power was not manifested. With increasing losses (or decay) there has come about a decrease in quality factor, which could be driven by genetic decay, and hence a decrease in age.
If one extrapolates the broken line in Figs 2 and 3, it becomes negative a a time a little less than A.M. 1638. In physics a negative loss means amplification, or regeneration, which means no losses at all. Possibly this was the state of Adam and Eve in the Garden, before their Fall from Grace. They lived in a state where the thermodynamics was operating but where the losses were constantly being cancelled by a regenerating force of God—God sustained His Creation, just like He did in the burning bush on Sinai.
Equation (2) is the same as we observe in a semi-conductor that initially is very cold and in darkness and is illuminated by light. The light liberates electrons trapped on defect sites in the material, which results in an increase in conductivity and hence losses. Maybe there are some parallels there also. God has illuminated our hearts through the progressive revelation in His Word, and though we now have decreasing age and hence quality factor, we are drawn “out of darkness into his marvellous light.” (1Peter 2:9)
References
- Hershey, D., Entropy Theory of Aging Systems, Humans, Corporations and the Universe (Imperial College Press, London, 2010)
- Sanford, J.C., Genetic Entropy & the Mystery of the Genome. (Ivan Press, 2005)
- A.M. = Anno Mundi = year of the world or since Creation.
- The curve fit statistics χ2 = 5.68 × 10⁻⁶ and R = 0.9897.
Related Reading
- Ancient Human Longevity and Its Rapid Decline
- What Happened After the Flood? Why Did Lifespans Decrease Rapidly?
- Does the Age of the Earth Really Matter?
- Book: The Physics of Creation, The Creator’s Ultimate Design for Earth (PDF) Premium subscription required.
Recommended Reading
Free Subscribers
Subscribe to our Newsletters as a Free Subscriber and be notified by email. Just put your email address in the box at the bottom of your screen.
You’ll get an email each time we publish a new article. It is quick and easy to do and totally free. You only need do it once.
Premium Subscribers
Subscribe to our Newsletters as a Premium Subscribers at $5 USD/month or $30 USD/year (you choose).
Paid Premium Subscribers will get exclusive access to certain content I publish. That will only cost you a cup of coffee per month.
Also you’ll be able to download, for free, a PDF of my book Apocalypse Now and also a PDF of my book Physics of Creation The Creator’s Ultimate Design for Earth.
You can download them from the link below.
This is how you can support my work. I have been publishing this website for 10 years now and up to 2024 I never asked for any support.
Press the button “Premium” on the front page to find a list of Premium content. Thanks so much to all supporters.
At a minimum, please join as a Free Subscriber. It’ll cost you nothing. It may also help me beat the shadow banning of some posts.


One response to “Age as a Quality Factor of Human Life After the Flood”
Theologically, the reason for different life-spans pre and post Flood could be that God made different covenants with people before and after the Flood, subject to different contractual conditions, resulting in different physical outcomes.
LikeLike