

Any historical investigation into the growth of human populations over past times is historical science. It relies on estimates based on historical accounts or circumstantial evidence derived from proxies, like food production, ability to wage wars, even the extent of plagues and famines. Given that we should take into consideration the possible errors in past population estimates.
From the available data it is easily seen that over the past 400 years the global human population has experienced a massive exponential growth. In order to investigate this I compiled population data from several sources and show it in plots below in Figs 1a and 1b.
The blue squares were taken from a Wikipedia article on World Population under the subheading Milestones by the billions. The red circles were taken from a Wikipedia article Estimates of historical world population, specifically from Gapminder data in the Table listed under the subheading Historical population, Before 1950. The green squares were taken from biblical sources including one written by Steve Rudd, Bible Chronology Charts, The Septuagint (LXX) vs. corrupted Masoretic. He gives year and global population 3200 BC to 2850 BC, Nimrod, Babel, Nineveh to the Tower of Babel, Eridu Temple I. The first green datum is for the 8 people who came off Noah’s Ark in the year of the global Flood 3298 BC according to the Septuagint (LXX) chronology.
I now favour the Greek Septuagint (LXX) which presents a significantly longer chronology for the period from Adam to Abraham as compared to the Hebrew Masoretic Text (MT). The LXX places creation at approximately 5554 BC and the Flood at 3298 BC. This contrasts sharply with the MT chronology, with a creation date of 4004 BC and the Flood at 2348 BC (Ussher’s chronology).
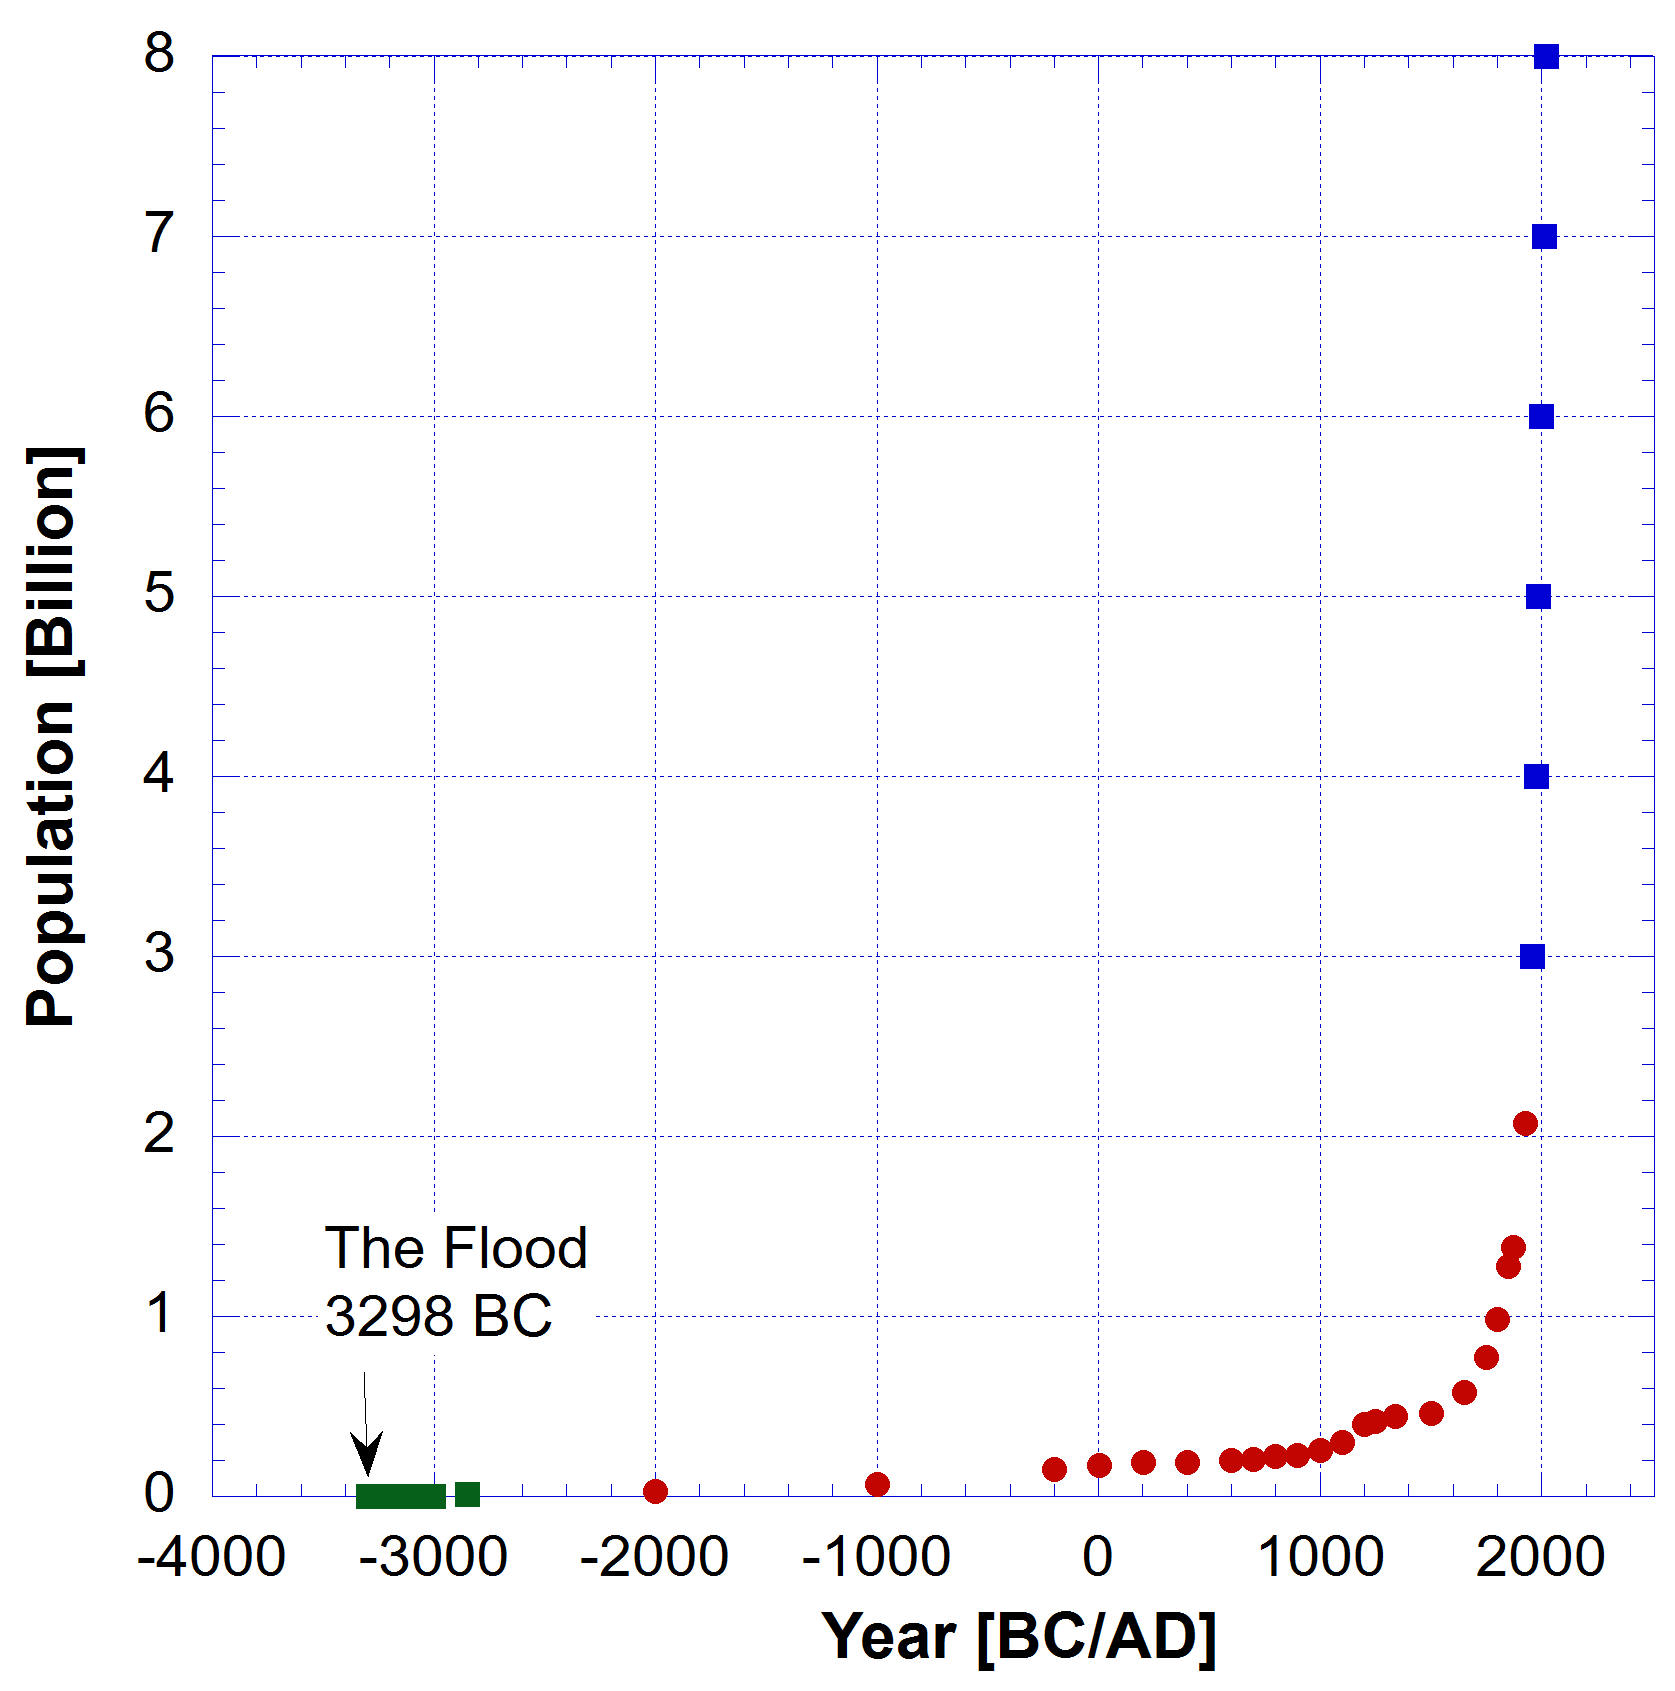
The post Flood data indicated here is from the LXX chronology which in my assessment is correct. However on a linear Y-axis details of the population growth are hidden. To see this region clearly we need to use a Logarithmic Y-axis, as shown on Fig. 1b below.
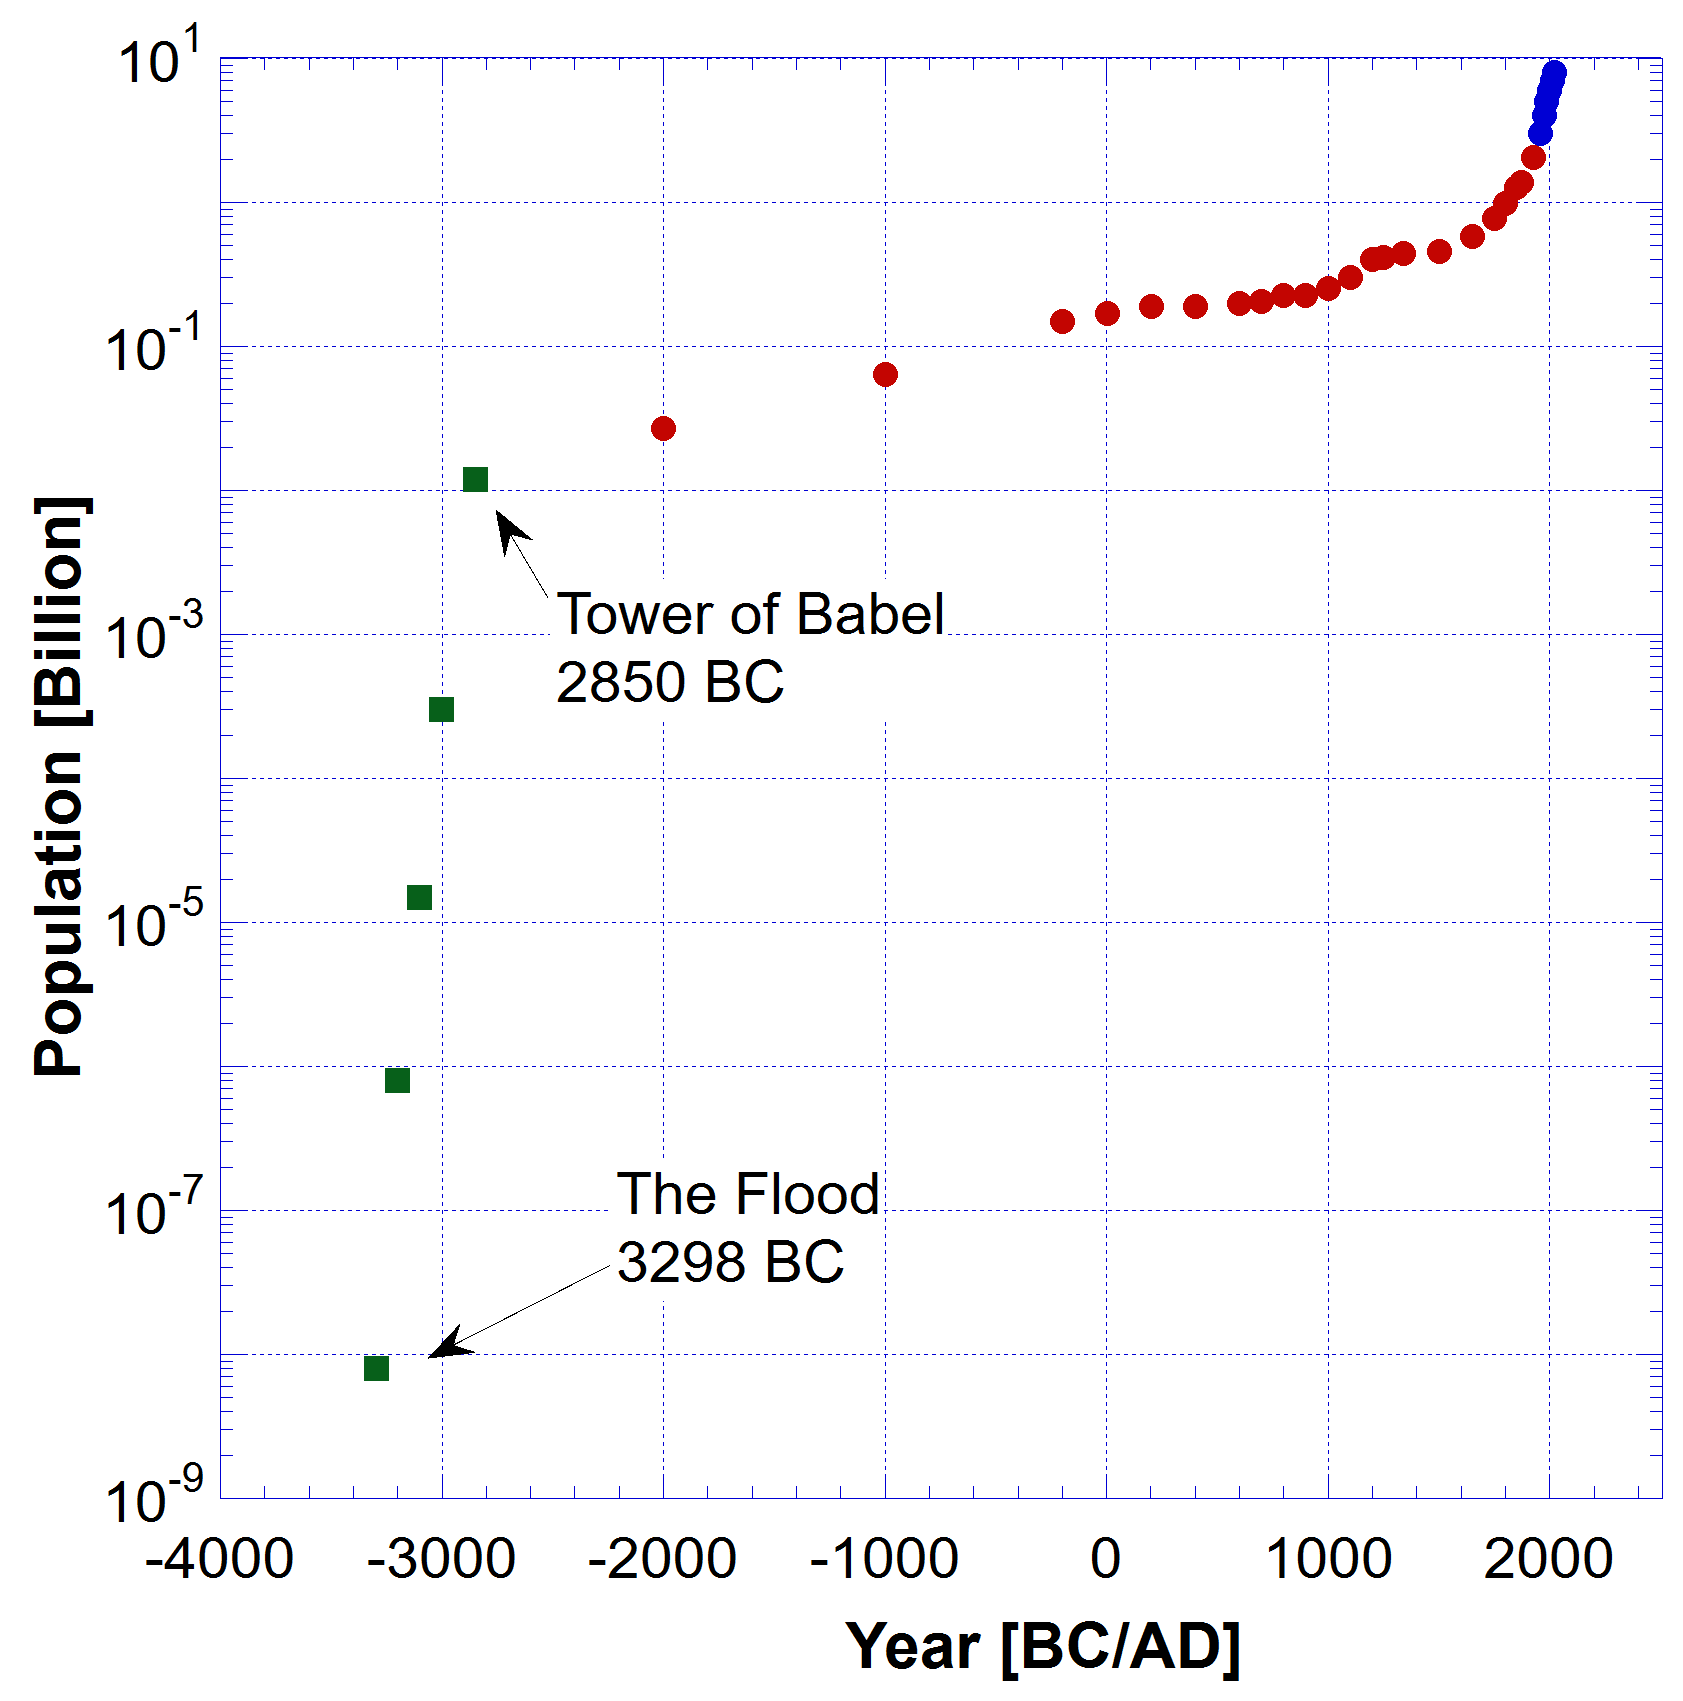
I chose to use only biblical based sources for times earlier than 2000 BC. The first significant date is the year of Tower of Babel in 2850 BC, which according to the Bible was built before the confusion of languages and the once-monolithic single-language-speaking population scattered to all regions away from Babel (MT Genesis 11:8). Peleg was born after that in 2767 BC (MT Genesis 11:16).
It is quite apparent from Fig. 1b that there is a change in slope of the trendline before and after the Tower of Babel in 2850 BC. That change of slope means a change in the rate of the population growth before the Tower of Babel and after it.
The human population was broken up into many different tribes speaking different languages. It is easy to imagine that that alone would have had a profound effect on population growth. Post Babel people would have found less options to marry and reproduce once they lost the ability to communicate with most of the rest of the humans on Earth.
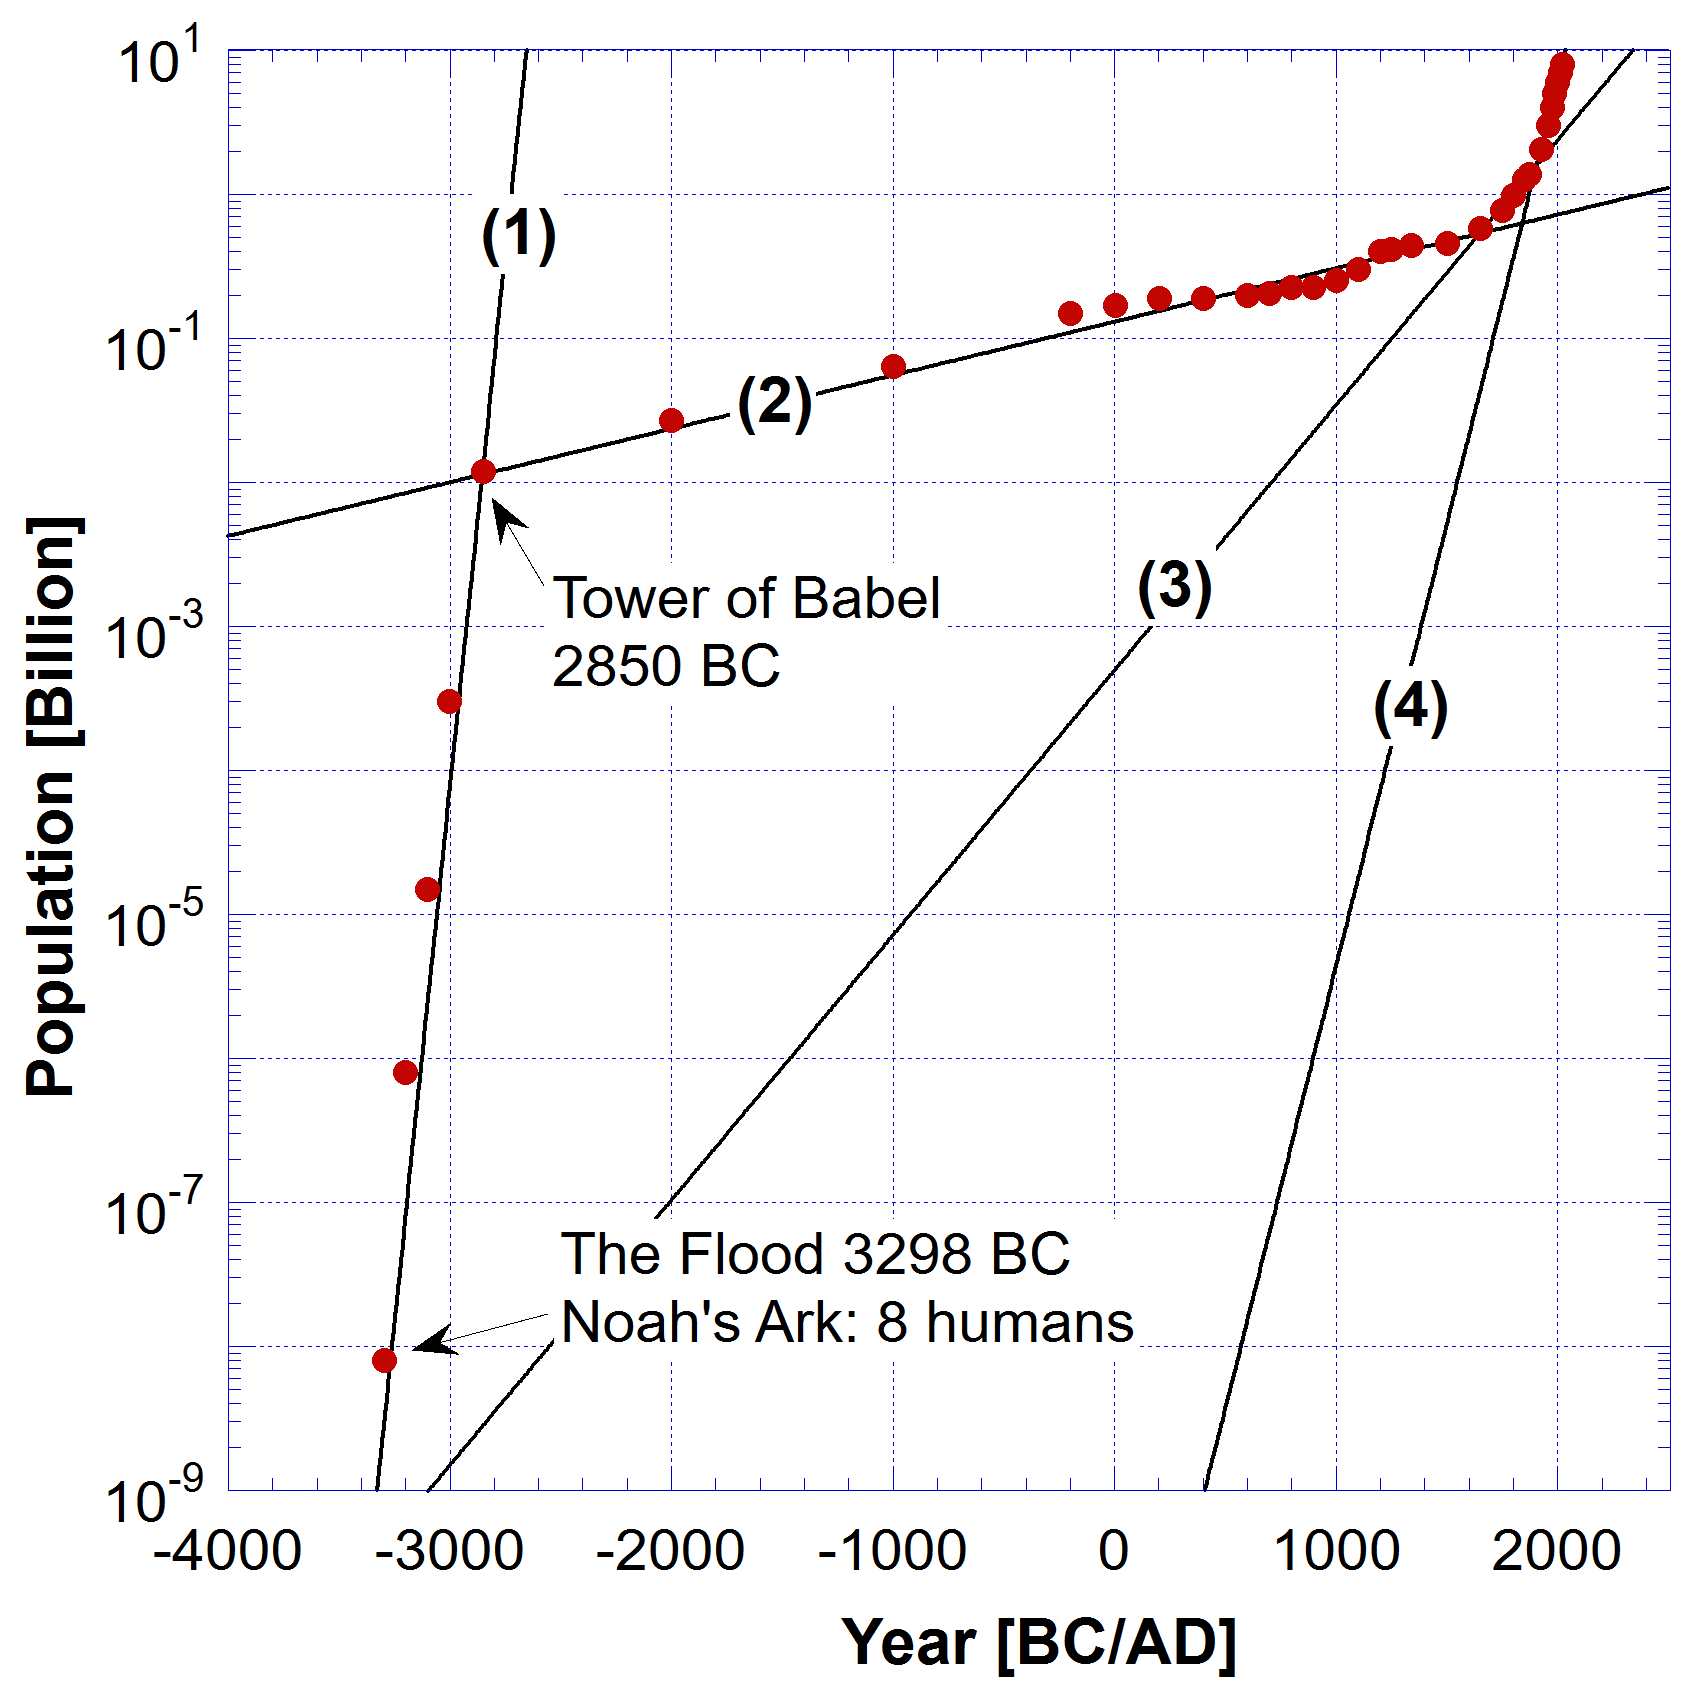
On a Log plot a straight line represents exponential growth. In Fig. 2 below I have reproduced Fig. 1b, but used only red circles for all global population data.
To four different epochs or time periods I fitted, by least squares analysis, the following equation:
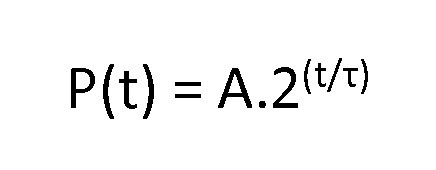
where P(t) is the global population as a function of time t, A is a fit constant and τ is a time constant. This equation is an exponential but written in the form of a doubling. Therefore if for example τ = 20 years the population P will double every 20 years.
By fitting this equation to the data over 4 different time periods as indicated in the Table below I determined the characteristic value of τ for each period.
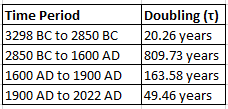
Curve (1) shows the population growth from the 8 people (Noah’s family) who came off the Ark up to the Tower of Babel. That period of time saw a doubling rate of 20.3 years. That is not inconsistent with what we know from the biblical text. With only 8 humans on Earth a period of rapid repopulation would have been required to guarantee that the human species survive.
With destruction of the single-language culture at the Tower of Babel a massive slowdown in the rate of population increase after the post Babel confusion of languages is also believable. Curve (2) with a doubling rate of nearly 810 years indicates this.
Considering the post Flood world environmentally would have been nothing like the pre Flood world, disease, famine and war would have been much more common. Agriculture would have been severely more limited, meaning the growth and security of food would have been a limiting factor on population growth.
The next two periods I discuss below using Fig. 3 where I have zoomed in on Fig. 2 showing only times later than 1000 BC.
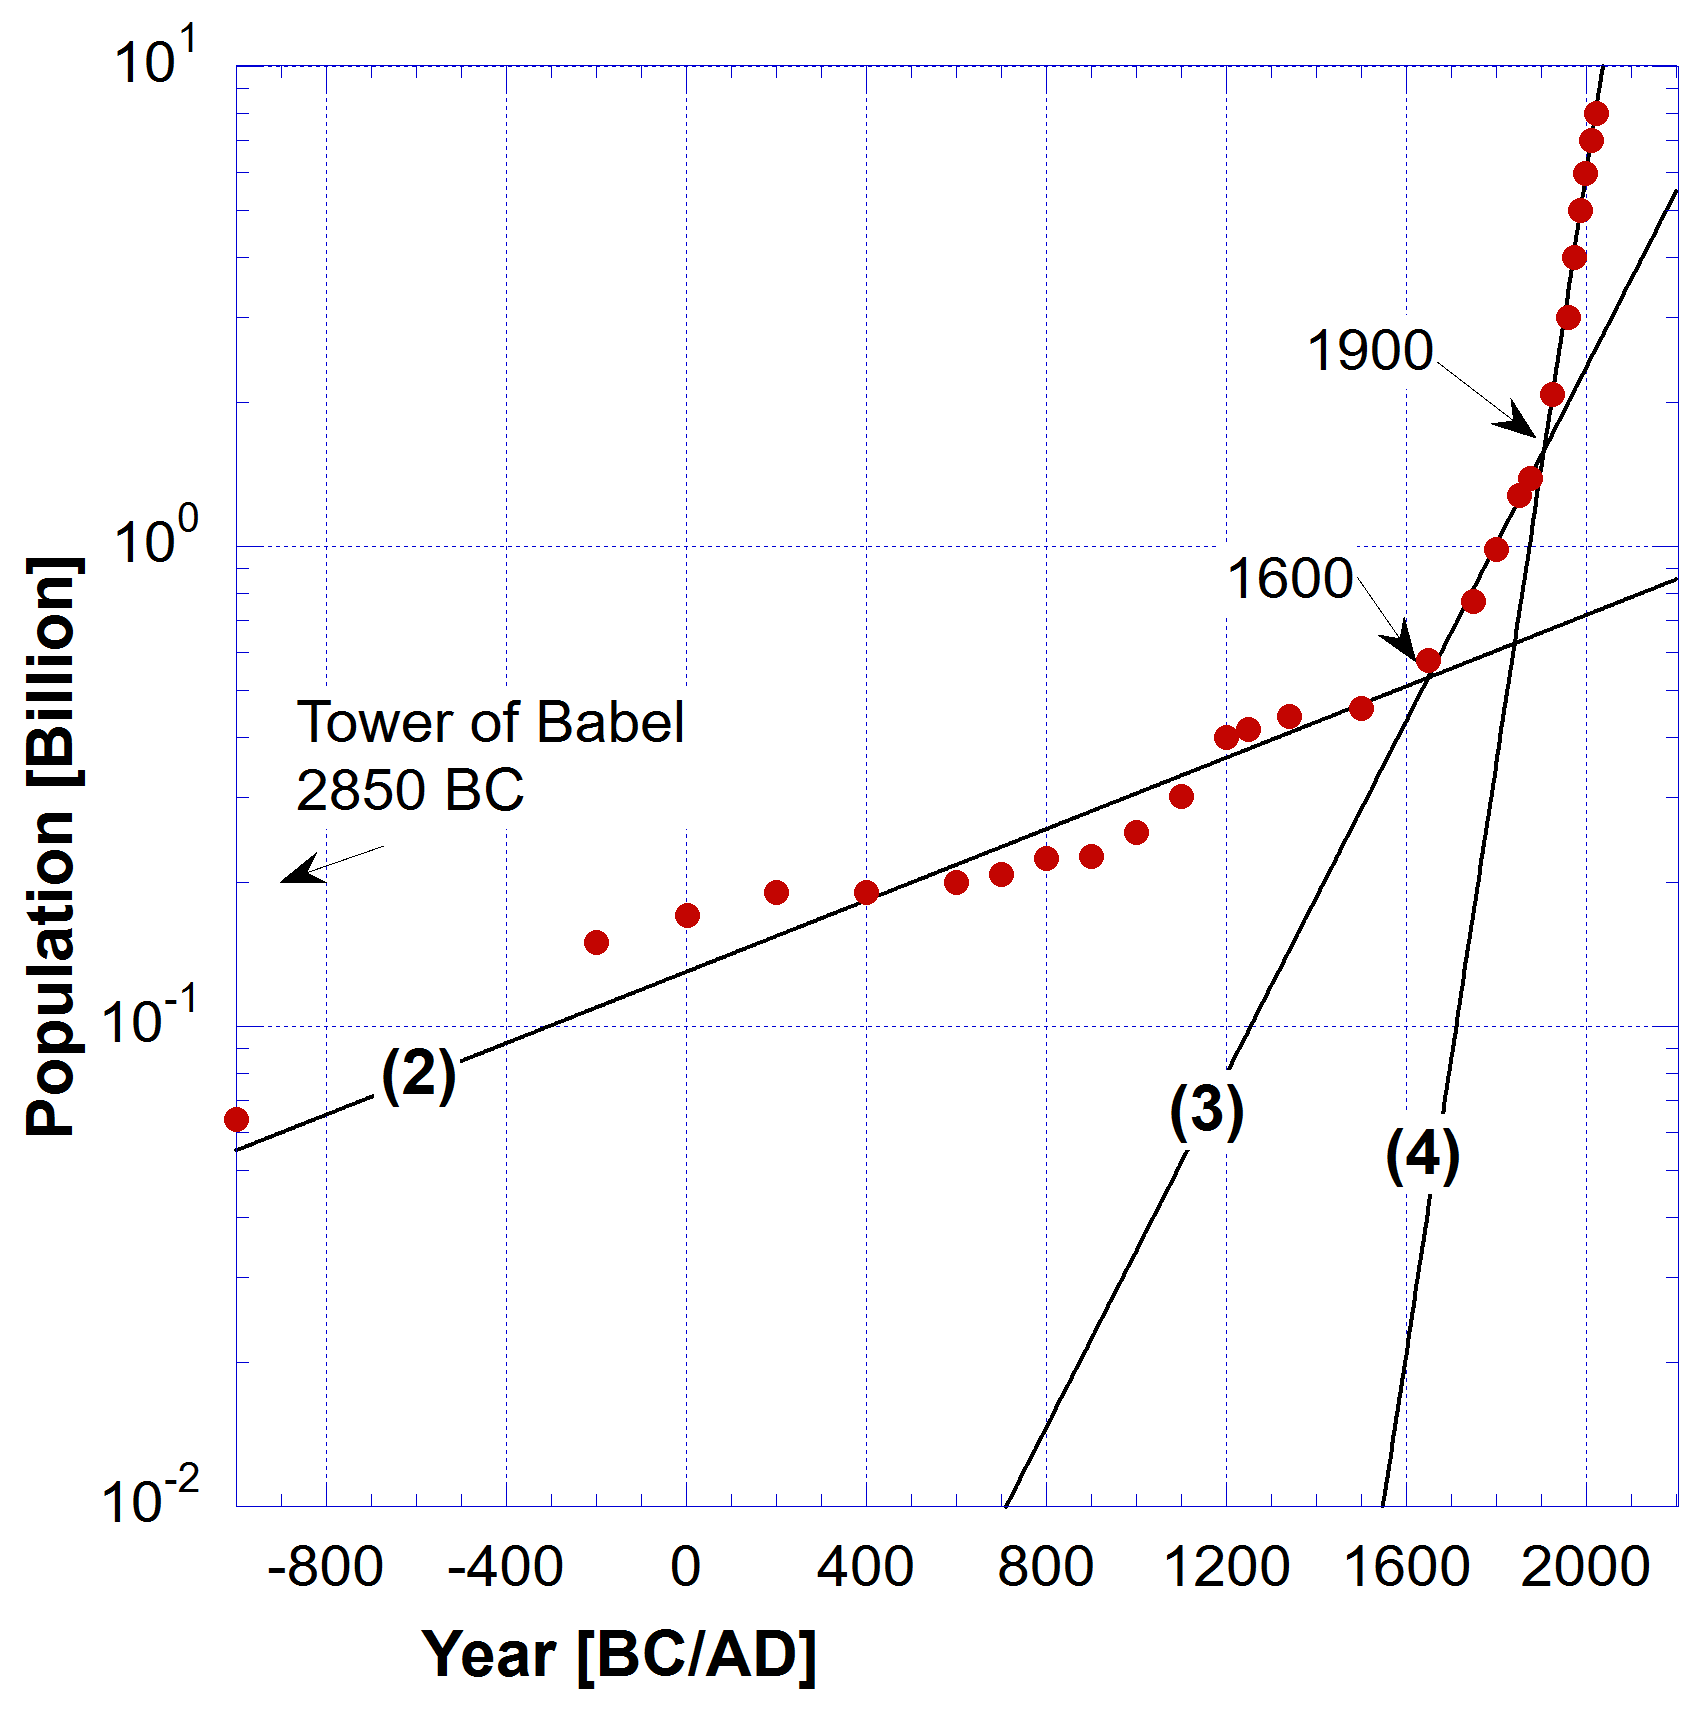
For the period 1000 BC to 1600 AD the population numbers rose above and fell below the exponential growth curve (2). But quite clearly around 1600 AD there is a distinctive upward trend to which curve (3) was fit. It gives a population doubling rate of 163.6 years, which is a significant acceleration on the prior period.
The year 1600 was pivotal in global history, witnessing transformative events across continents. For examples:
- Establishment of the English East India Company (December 31, 1600): Granted a royal charter by Queen Elizabeth I, this company became a major force in global trade and colonial expansion, laying the foundation for British influence in India.
- First European contact with Japan (April 19, 1600): The Dutch ship Liefde arrived in Japan, bringing William Adams, an English navigator who later became a trusted advisor to Tokugawa Ieyasu.
- The beginning of the Dutch colonization of Australia (1606): The Dutch ship Duyfken, under Captain Willem Janszoon, became the first European vessel to land in Australia, claiming the western coast for the Dutch East India Company. On 18 January 1788 Captain James Cook had landed his First Fleet in Botany Bay Sydney, which accelerated the colonisation of the continent.
- The colonization of the United States began in the early 17th century as European powers, particularly England, France, and Spain, competed for control of North America. The first permanent English colony, Jamestown, Virginia, was established in 1607, primarily driven by the pursuit of wealth through resources like tobacco.
- The Industrial Revolution began in Great Britain around 1760 and lasted until approximately 1840, marking a shift from agrarian and handicraft economies to industrial and machine manufacturing.
- In this period Michael Faraday made foundational contributions to science, particularly in electromagnetism and electrochemistry. His key inventions and discoveries include the Electric Motor (1821) and the Electric Generator (1831): He created the first generator, which led to modern dynamos and generators, and ultimately electrification of society.
These events set the stage for centuries of political, scientific, and colonial change across Europe, Asia, and the Americas.
In short 1600-1900 was a period of rapid colonialism where more than half of the world was conquered by the expansion of imperial nations. New lands meant expansion of the European populations into the new world, the reaping of the resources of those lands and thus wealth for the colonisers. That led to increased prosperity and population increase.
It was a period of rapid scientific discovery and advances in medical practices. Health was improved by improved sanitation and quality of food production. Industrial and machine manufacturing saw rapid development of transportation which meant fresh food could be quickly gotten to markets and as such improved health and prosperity.
Around 1900 there is another distinctive upward change in trend to which curve (4) was fit up to 2022 (the limit of the data). The curve fit gives a population doubling rate of 49.5 years, which is a further significant acceleration over the prior period (1600-1900).
The year 1900 marked the dawn of the 20th century and was a pivotal year in global history, characterized by technological innovation, scientific advances, imperial expansion, international communications, global trade and escalating international tensions.
- The Open Door Policy was announced by U.S. Secretary of State John Hay, advocating for equal trade access to China among all foreign powers.
- Guglielmo Marconi successfully transmitted the first transatlantic wireless signals on December 12, 1900, a milestone in long-distance communication. After that worldwide radio and television signals flooded the world.
- The Wright brothers continued their work on powered flight, culminating in their first successful flight in 1903. From then air travel eventually became ubiquitous.
These events collectively set the stage for the transformative developments of the early 20th century, including the rise of modern warfare, mass industrialization, and the eventual outbreak of World War I.
The first industrial-scale application of Haber-Bosch process, which is the industrial method used to synthesize ammonia — the foundational compound for most synthetic nitrogen-based fertilizers — began in 1910 in Germany. The use of natural gas as a feedstock became widespread after the mid-20th century.
Thus, natural gas became central to modern fertilizer production starting in the 1950s and 1960s, enabling large-scale, affordable nitrogen fertilizers that dramatically increased global agricultural yields. Increased agricultural yields meant increased populations.
Synthetic nitrogen fertilizers increase crop yields by a factor of 4, making them essential for feeding the current global population. Without them, the world’s population would likely be reduced to 3.5 to 4 billion people, according to multiple estimates.
From Creation to the Flood
The population growth in the pre Flood world is very problematic. However we do have some biblical facts to go on.
From the Bible we know that the creation was around 5560 BC (LXX and Henry B. Smith Jr, ICC 2018 paper). I have used that date in the following Fig. 4.
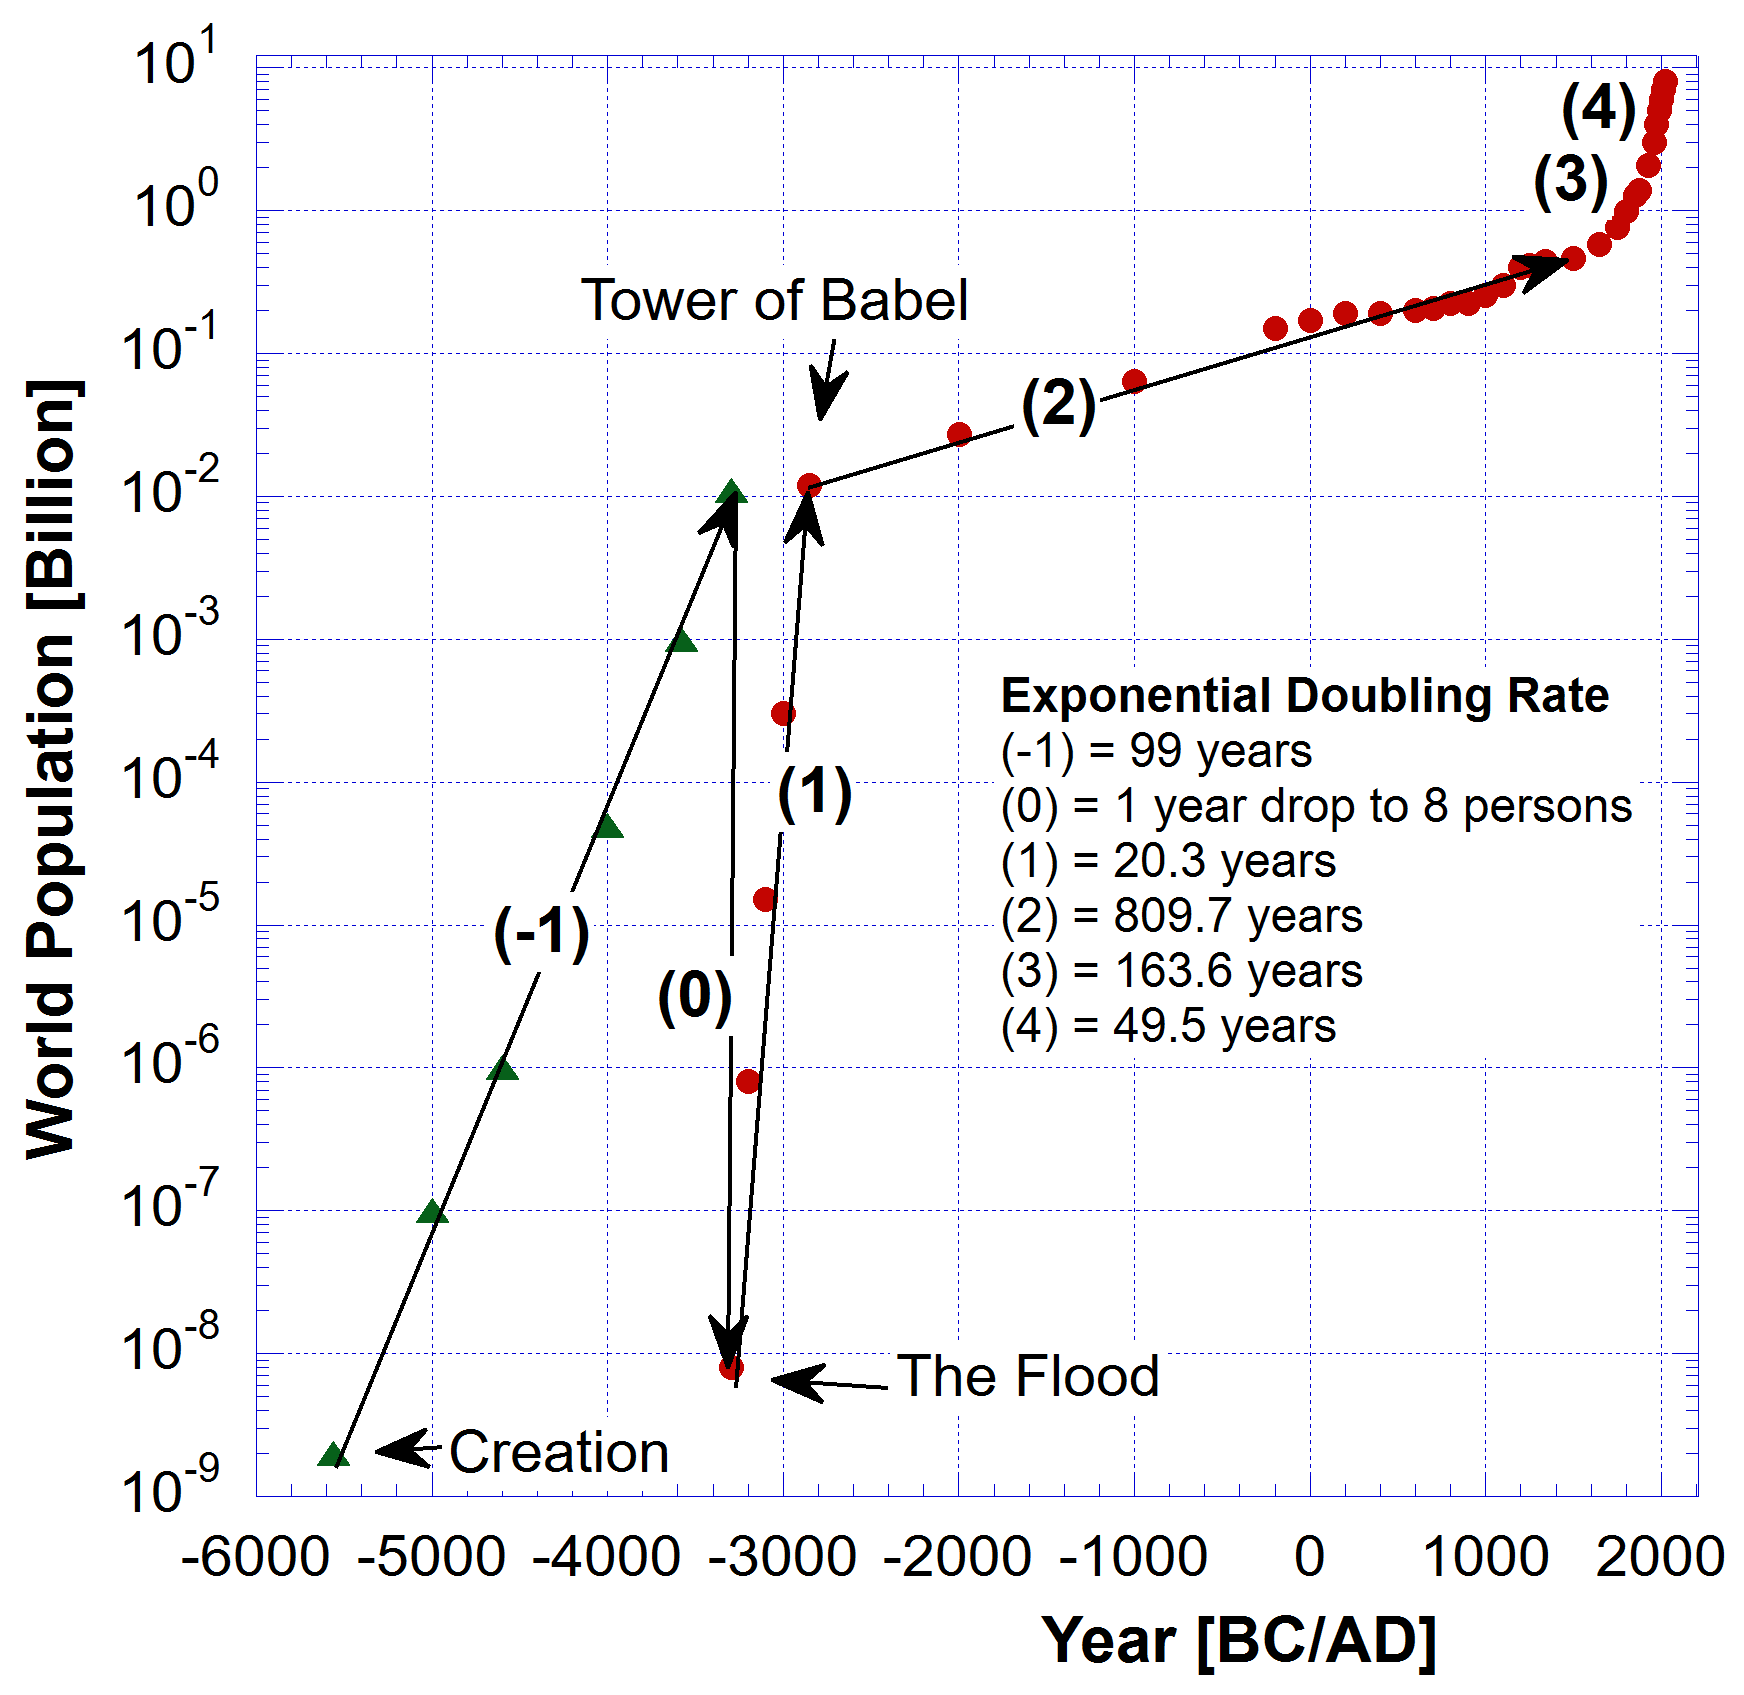
We start with the initial human population of 2, Adam and Eve. Since Eve was the mother of all living humans, all other people are the offspring of these initial 2. The green triangles in Fig. 4 start with the two first humans.
Considering that most of the patriarchs pre Flood are listed in the Genesis 5 genealogies as begetting their first male offspring around the age of 100, some more, some less, I chose a doubling rate for the world population in the pre Flood period close to 100. Each patriarch mentioned may have had many children but the first seemed to be after this initial period.
Perhaps Adam and Eve were an exception. They were created fully mature so no period of maturation was required. That may have led to an initial rapid start in their offspring population.
Also I made another assumption that the pre Flood population rose to a number very close to the post Flood population when it peaked at the Tower of Babel. Thus the green triangle data is simulated but starts with 2 humans and ends with the same Babel population.
This initial rise in population is very fast, but not as fast as the doubling rate in the period (4) after 1900 until the present with a 49.5 year doubling rate, nor as fast as the post Flood period, arrow (1) in Fig. 4, with a doubling rate of 20.3 years.
In Fig. 4 the straight line arrow labelled (-1) has an exponential doubling rate of 99 years and rose to a population of about 12 million just prior to the collapse when all but 8 people were drowned in the great Flood. The straight line (0) indicates this with the downward arrow. That is followed by arrow (1) with rapid population growth and then at the Tower of Babel a gradual increase following arrow (2).
The global Flood was an historical singularity from which the world population quickly recovered and continued an upward growth. Since then it has always been upward but for how much longer?
That singularity was the first Great Reset. God brought on the global Flood and killed all airbreathing land animals except those on the Ark. Only 8 humans out of 12 million survived. Could that be a foreshadowing of what is to come in our future?
Future Population (after 2022)
Something can be said about the future trend of population growth. In the same Wikipedia article I extracted the post 1950 data from they include two future dates, 2037 (9 billion) and 2057 (10 billion). These are indicated on the Fig. 5 below. They also include projections for future depopulation which is euphemistically called degrowth.
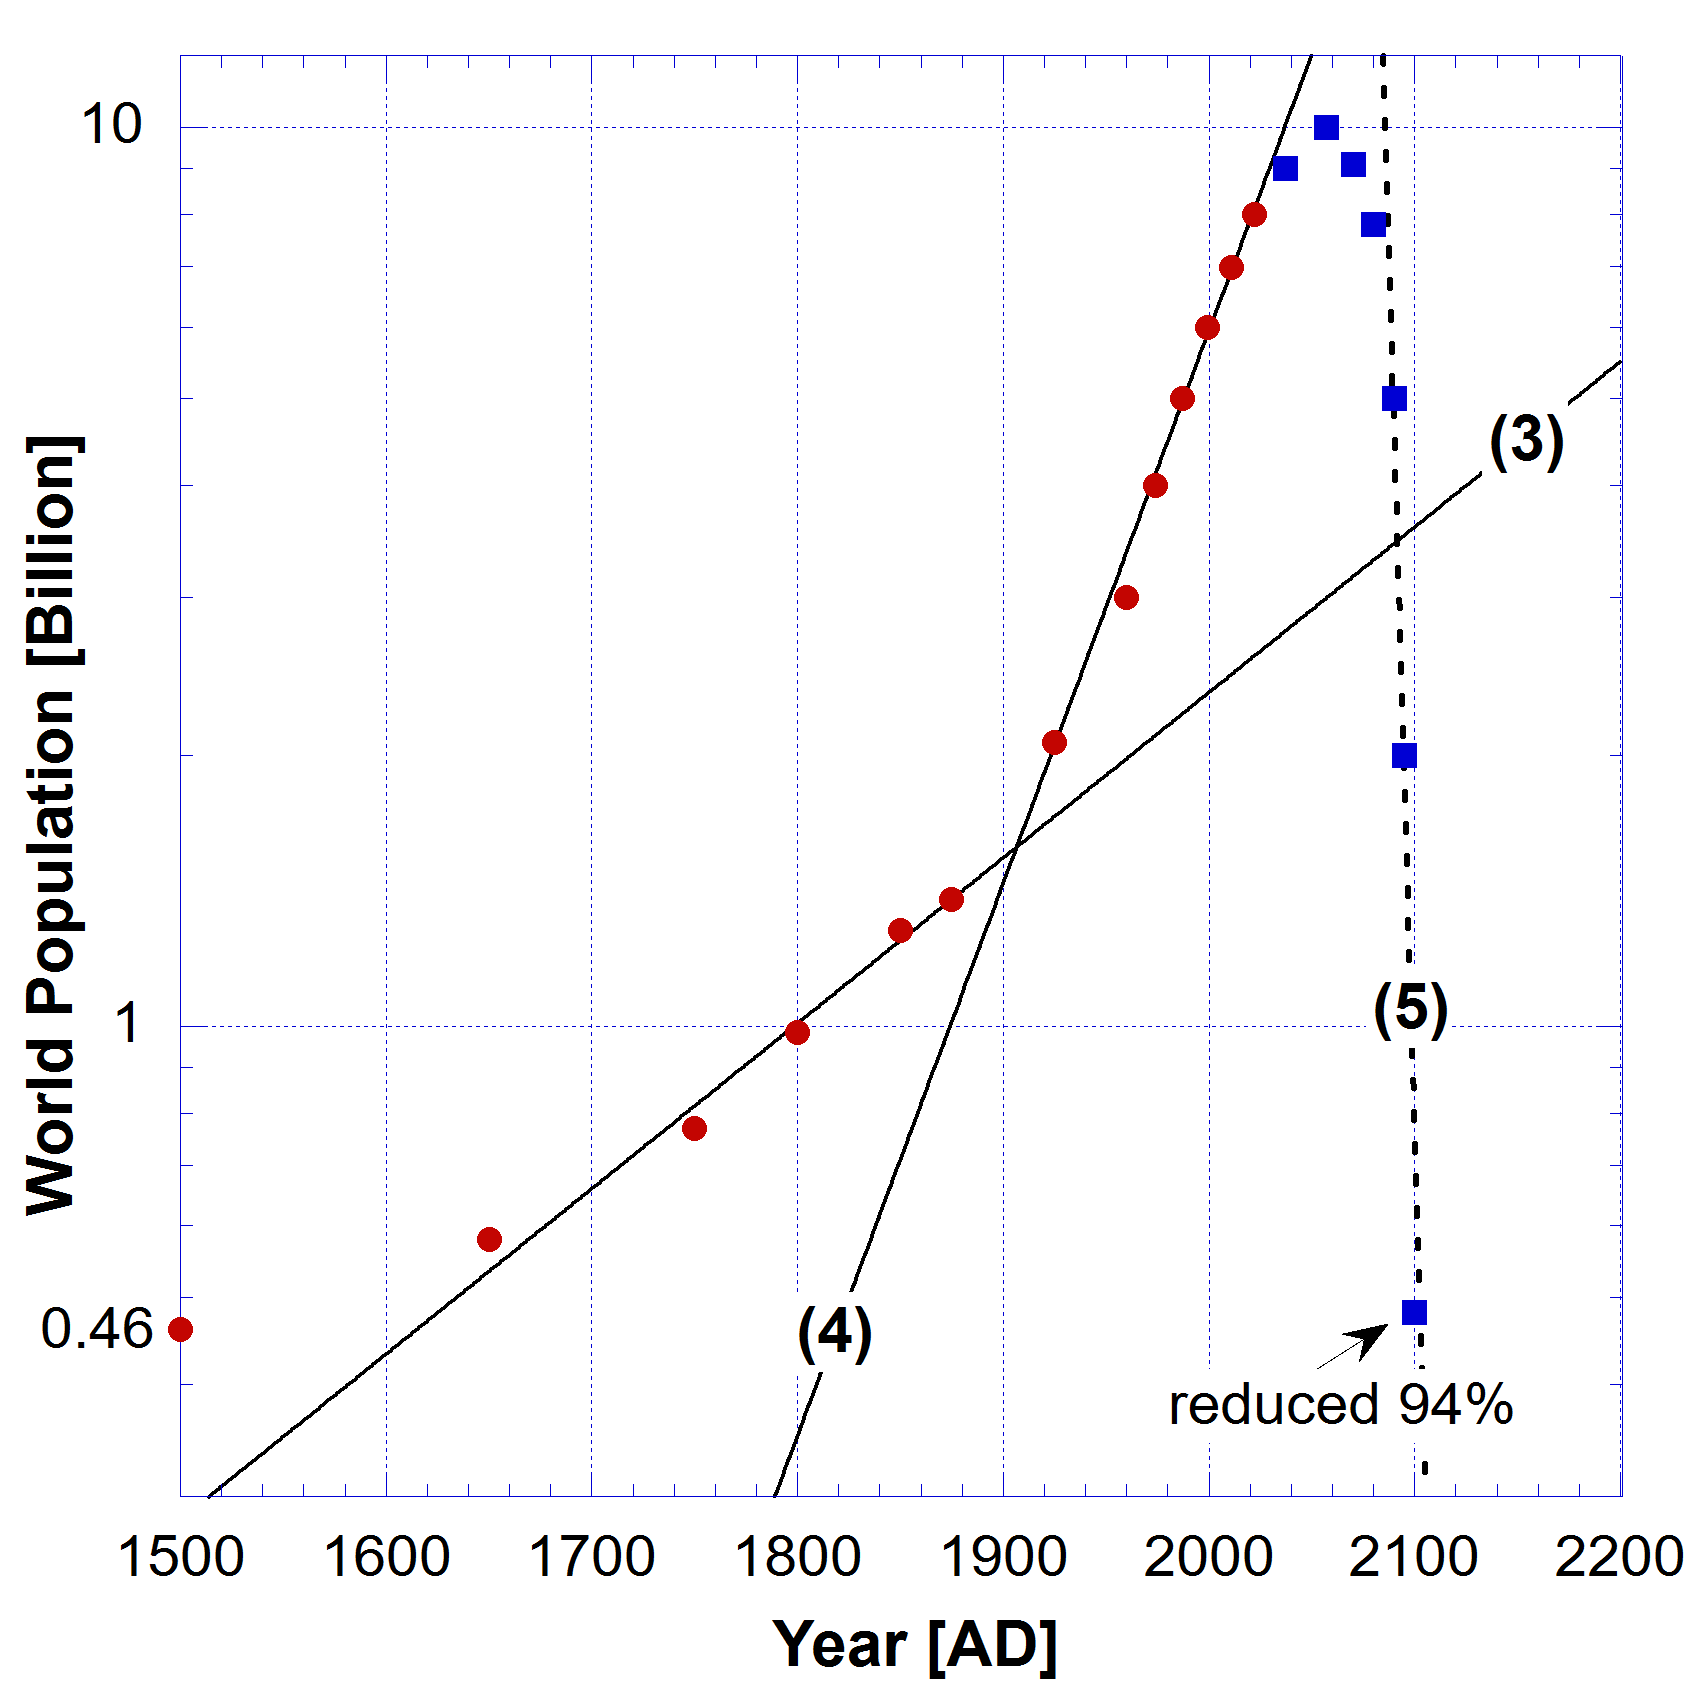
The blue squares are simulated data which achieve the goal of the Club of Rome/WEF to reduce the world population by 94% getting it just below 500 million by 2100. The dashed curve fit (5) has an exponential halving rate of 3.9 years. That is, halving not doubling!
To achieve a population collapse, degrowth, that halves the population every 4 years would require global nuclear war and/or global plagues with high virulence and/or mass starvation due to famine.
The figure of 94% reduction in the world population, bringing it back down to the world population of about 500 years ago, is what primatologist Jane Goodall suggested she would like, at 2020 WEF meeting in Davos.
She said: “All these things we talk about wouldn’t be a problem if there was the size of population that there was 500 years ago.” However there is controversy about what she meant and the context in which she said it.
Looking at Fig. 5 you see that 500 years ago the global population was 0.46 billion which is just below 500 million. 500 million is the number that was written on the Georgia Guidestones before they were mysteriously blown up. All a coincidence? I think not.
Prominent Club of Rome member, Dennis Meadows, hopes the “necessary” depopulation of Planet Earth, down to one billion—an 87.5% reduction from today’s population—can “occur in a civil way”.
“The planet can support something like a billion people, maybe two billion, depending on how much liberty and how much material consumption you want to have. If you want more liberty, and more consumption, you have to have fewer people. And conversely, you can have more people. I mean, we could even have eight or nine billion, probably if we have a very strong dictatorship.”
Club Of Rome Member Hopes Depopulation Of Earth Can ‘Occur In A Civil Way’, 2023
Mr Meadows advocates for a smaller percentage 87.5% or less but that it should be done in a civil way. Nuclear war, engineered famine and engineered plagues are hardly civil.
If you take Revelation chapters 6, 8 and 9 at face value and depending on how you calculate the fraction of mass population losses in those catastrophic events you may get a global depopulation figure of between 65% to 85%. That would be rapid depopulation over a short time frame, which could easily fit an exponential halving rate of 4 years.
In the notes to the video of Matthews’ talk the following is written.
“When it comes to hope, Meadows – knowing collapse of the current global system is certain – hopes for a peaceful, slow collapse, more like a degrowth transition. To get there still requires revolutions, very many revolutions, on all thinkable levels – from the personal to the way we organise politics and the way we reward corporate CEOs. We need everything.” (my emphases added)
The criticism of Jane Goodall’s depopulation figure being taken out of context is that it is “conspiracy theory”; the Great Reset is conspiracy theory. But Klaus Schwab wrote a book titled “COVID-19: The Great Reset”. Read The Great Reset Ain’t No Conspiracy Theory!
“We need a great reset” … “Now is the historical moment, the time … to shape the system”
Here on this Bitchute video Klaus Schwab said exactly that. The COVID-19 fake pandemic was the first step in their Great Reset.
But what if God turns the tables on them and uses them in their maniacal rush to global nuclear war, plagues and famines to rapidly depopulate the planet but instead as His judgments on mankind, especially on the wicked pedophile Epstein class? Read Revelation chapters 6, 8 and 9.
This would be one of the last chapters in human history before the immanent coming of our Lord and Saviour, Messiah and King, Jesus Christ. Just saying!
Make sure you have had Jesus’ Great Reset in your heart!
Recommended Reading
- Free PDF of My Book ‘Apocalypse Now’ for Premium Members
- Merchants of Death: Global Oligarchs and Their War On Humanity
Related Reading
- Revelation 6: The Four Horsemen Bring Global Depopulation
- Revelation 8: 7th Seal Opened
- Revelation 9: Abyss Opened
- Climate Change: The Pretext to Decarbonise the Planet
- Are We the Last Generation?
- Bill Gates | Depopulation by Vaccines and Elective Abortion
- Global Depopulation: Insights from Dr. Yeadon’s Warning
- Bird Flu, the Next Pandemic for Global Depopulation?
- State Imposed Global Depopulation in the Last Days
- Global Depopulation by WEF
- Exposing the Great Reset: Digital Control or Freedom?
- Lessons from the Tower of Babel: AI’s New Age
From now on most new posts will be Subscriber only. Most of those will be Free Subscriber posts. Please subscribe.
Free Subscribers
Subscribe to our Newsletters as a Free Subscriber and be notified by email. Just put your email address in the box at the bottom of your screen.
You’ll get an email each time we publish a new article. It is quick and easy to do and totally free. You only need do it once.
Premium Subscribers
Subscribe to our Newsletters as a Premium Subscribers at $5 USD/month or $30 USD/year (you choose). Cancel anytime.
Paid Premium Subscribers will get exclusive access to certain content I publish. That will only cost you a cup of coffee per month.
Also you’ll be able to download, for free, a PDF of my book Apocalypse Now and also a PDF of my book The Physics of Creation The Creator’s Ultimate Design for Earth.
You can download them from the link below.
This is how you can support my work. I have been publishing this website for 10 years now and up to 2024 I never asked for any support.
Press the button “Premium” on the front page to find a list of Premium content. Thanks so much to all supporters.
At a minimum, please join as a Free Subscriber. It’ll cost you nothing. It may also help me beat the shadow banning of some posts.








Leave a Reply