‘War, Boom, Bust’ is often heard in the context of economic cycles in history. A war is needed to get a country or empire out of the doldrums of the last economic bust. The manufacturing industry building war machinery is turned on and that fuels the economy, driving enormous ‘boom’ activity which gives the illusion and also the reality of prosperity, at least temporarily.
A small number of industrialists and banksters become extremely rich. But the boom is only a veneer, because war never builds a society, it only destroys, and the boom does not last. It always comes crashing to an end. Inevitably, as the war machine comes to a halt we get the next ‘bust’ in the cycle – a depression which can last for many years.
You can look back thousands of years and you will see the tendency to deface the money of the realm to finance wars. The Romans melted down their pure silver or gold coins and added base metals to expand the currency supply. The more base metals, like copper, were added the more the real money is deflated.
After the printing press was invented paper currency could easily be printed. This saw extreme periods of ‘money’ printing and hyperinflation. Assignats were paper money (fiat currency) issued by the Constituent Assembly in France from 1789 to 1796 during the French Revolution. They were printed to address the imminent bankruptcy of the state, but it only led to more and more fiat currency printing and massive price hyperinflation.
Human civilisation since 1900 has experienced two major world-encompassing wars. Wars cost a lot of money and countries, even if they were initially on a gold standard, usually start massive money printing to finance their wars. This fact can be seen in the US Federal Reserve (FED) liabilities, for which data is available, from the time of their inception in 1914, just before the beginning of the first world war.
If we look at the FED liabilities taken from its published reports, and if we normalise those dollars to 1914 dollars, then we get the following Chart 3. The normalisation was achieved using the FED M2 money supply data for the years between 1959 and 2023 as shown in Chart 1. This means with the FED liabilities we are truly comparing ‘apples with apples’ as all the results shown in Chart 3 are priced in the same 1959 dollars.
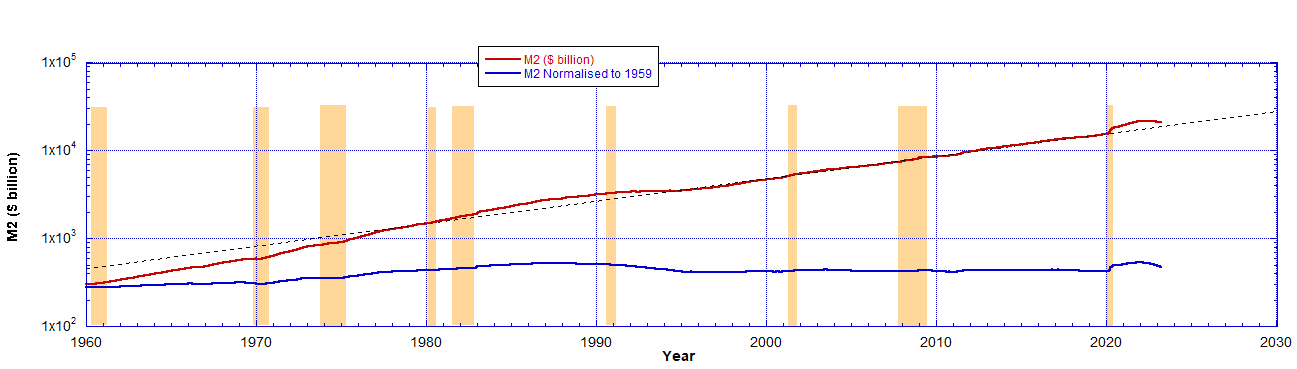
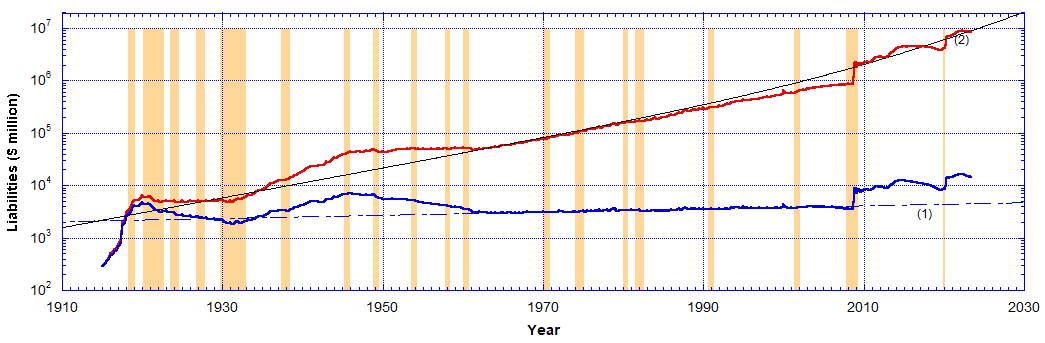
Chart 2 shows the FED liabilities from its inception (1914) to the present, extracted from their balance sheet reports. These are shown on a vertical log scale plot.
I used the exponential fit to the M2 money supply from Chart 1 to normalise the FED liabilities to 1914 dollars (blue line in Chart 2).
Now take a closer look at the FED liabilities on its balance sheet, but where the dollars have been normalised to 1914 dollars. This has the effect of stripping out any inflation effects.
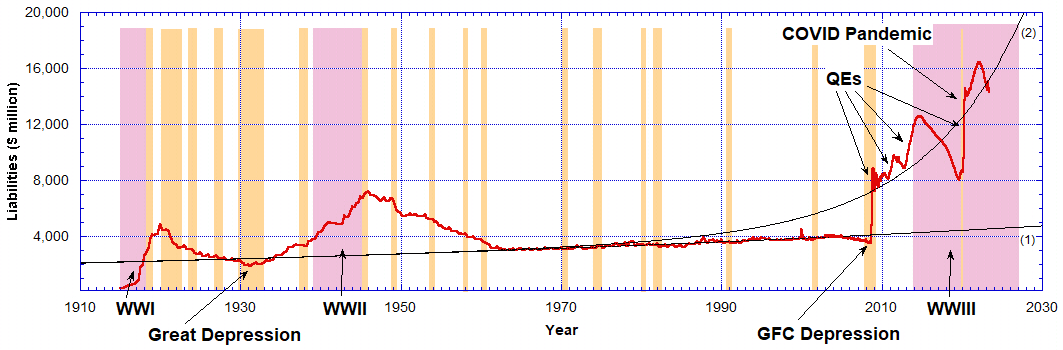
The Chart 3 indicates that due to the massive war spending, FED liabilities expanded significantly up to 1920 and then to 1946 after which they were contracted in the post-war periods. The triangle-shaped humps above the trend line (1) and labelled WWI and WWII indicate this fact. But note between these periods of massive money printing was the Great Depression of 1930-32. The liabilities dipped below the trend line (1) then.
Now looking to the period after 2000, we see again the liabilities dipped below the trend line and indicate the depression brought on by sub-prime mortgages in the Global Financial Collapse (GFC). After this, the FED massively began expanding its liabilities. It roughly follows the exponential growth indicated by trend line (2).
In 2014 the FED began again contracting its liabilities until 2020 when the Covid pandemic started. Is it a coincidence that the Russia-Ukraine war also started in early 2014 in the Donbas region of the country after the over-throw of the democratically elected government of President Viktor Yanukovych via a US-backed coup? For this reason we have drawn the start of a potential new world war, a third world war (WWIII), from that time on Chart 3.
If we take the real value of the expansion of the FED liabilities between 1934 and 1963 due to the second world war and compare to the total liabilities from 2008 to 2023 we find the latter is 2.3 times larger at its peak than in the case of the second world war.
Couple this with the fact of the GFC depression in 2004 to 2008 just before the massive currency printing started in 2009 (i.e. quantitative easing QE1 followed by QE2, QE3, and QE4) does it indicate that we are already in the grip of a third world war?
A comparison with previous world wars indicates also that the FED started shrinking its balance sheet after the war was over, which makes a lot of sense, when the demand for war munitions and other wartime supplies is not needed as much.
Do we have the equivalent situation now?
The FED has been aggressively expanding its balance sheet from 2020 after a period of quantitative tightening (QT) from 2014 to 2019. But that latter QT was only because of the massive expansion under QE1 to QE3.
The second trend line (an exponential) fit to the data above 2003 is indicated by the solid line (2) in Chart 3. From this we see that the periods of QT have brought the FED liabilities down to just touch this trend line (2). It is hard to see on this scale, but the monetary easing used to bail out SVB, Signature, and the other banks in March also brought the liabilities up to this trend line (2) briefly before QT continued.
It seems that the FED should be tightening (QT) and pulling its liabilities down to get back to trend line (1) when in fact it is expanding (QE) on an upward exponential fashion along trend line (2).
If we are to follow from history, we can only expect aggressive QT to occur after the next world war is ended.
Currently, all the news is that the Nato/Ukrainian war with Russia is being expanded. Biden has ostensibly sent hundreds of billions of dollars in military assistance to Ukraine already. Many of the European Nato countries are joining in supplying arms and money.
The rhetoric is constantly being increased therefore it would seem that this kinetic war needs to end before the FED liabilities can be contracted back down to the trend line (1) indicated in Chart 3. When will that happen? We don’t know; ask Biden? Or whoever is running him…
A round of massive QT, with much higher bank savings rates, could do it, but with the concomitant price inflation caused by all the massive QEs after 2009 would bring the world to financial Armageddon. You can see from the chart that the only way out for the FED is to bring their balance sheet liabilities back down to the 1963 to 2003 trend line (1). But at what cost? More bank runs and bank collapses like happened in March this year? However, it would seem that a kinetic third world war is inevitable if past wars are our teacher.
I recommend you watch Rafi Farber on YouTube under End Game Investor.
It is good to know we are near the End Game, the crack up boom, as the global currencies collapse and the world changes forever.
- Has World War III Already Begun? on Mises.org
- Listen to the Audio Mises Wire version of this article.
Recommended Reading
- Book: Apocalypse Now: On the Revelation of Jesus Christ
- Book: Merchants of Death: Global Oligarchs and Their War On Humanity
Follow me
- Telegram.org: @GideonHartnett
- Facebook: Gideon Hartnett
- X (Twitter): @gideon195203
To be notified by email put your email address in the box at the bottom of your screen. You’ll get an email each time we publish a new article.
Click this image to make a secure Donation (Stripe) !


One response to “World War III Has Begun (at Least Against the Currency)”
Reblogged this on Ponder Anew (What The Almighty Can Do) by Mensch59 aka Gary and commented:
In this war against currency, which is a war against the people (i.e. the masses), the people are too stupid and ignorant and deceived to understand that they are in a class war against their own governments and states and rulers and puppet masters. Who is controlling the governments, the states, the rulers, the puppet masters? Who is the master mind behind this war?
LikeLike