
The US Federal Reserve central bank was founded by Congress with the Federal Reserve Act in 1913. Its primary role was to manage the nation’s currency and maintain stability of the American banking system. What the Fed does with “money printing” or creating credit out of thin air has a significant effect on the stock market and on the wider financial system. The following analysis indicates a coming crash of the stock market with a halving of the Dow Jones Industrial Average (DJIA) index.
Chart 1 shows the Fed M2 currency supply growth as derived from the Federal Reserve Electronic Database (FRED). It is my view that everything that happens in the world hinges on this “money printing”, which inflates the prices of everything.
In 2020 the “money printing” was put on steroids during the period of the COVID pandemic as indicated below. Prior to that, the expansion of credit could be well modelled as an exponential growth curve (1), as expected. To keep the Ponzi scheme going more “money” has to be pumped into the system and the amount added must grow in proportion to the total amount in existence.
But when the “helicopter money” began raining down the exponential expansion curve could no longer correctly describe the growth as shown in Chart 1. To model the effect of the massive Quantitative Easing (QE) #4 in 2020 and after, a 5th order polynomial fit (2) is needed to be used.

The Ponzi scheme is now sitting at a point of unstable equilibrium like rocks precariously piled on top of each other. Each time the Fed tinkers with the monetary system it is adding another stone even more unstable than the last one.
The core contention here is that the expansion of the M2 currency supply, the most liquid currency, is the underlying driver of all markets. In the following I compare and contrast the Fed liabilities (a measure of all debt created) with the Dow stock market index, and the price of gold.
Previously I have examined the US Fed liabilities, the US National Debt and the price of gold and silver after the inflationary effects of currency printing were stripped out. The M2 currency supply effectively achieves that. I also found that the official CPI Inflation does not correctly “de-inflate” the historical prices of gold, silver and crude oil. Therefore in this analysis only the M2 currency supply will be used to strip out any effects of the deflating dollar.
Chart 2 shows the Dow expressed in 1914 dollars, after this method was used. At all times the DJIA is priced in 1914 dollars over the time span of this chart. It is obvious to see that there is no increasing trend with time. This means the effects of dollar deflation have been eliminated. Except for the big peak in 1930 the Dow lays within a band + 20 and – 20 around its mean value indicated by the dashed line (1).
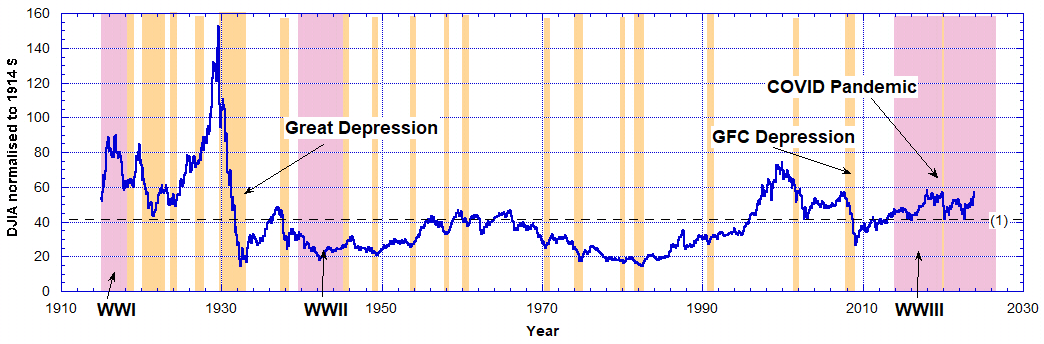
By using the same dollar unit in all years (it does not matter which) the Dow index can provide us information on the stock market trends and human action. Reading from Chart 2, I make the following comments.
During World War I period the Dow began rising in 1915 and then crashed in 1918. During World War II (1940-1945) the Dow initially dropped and then in 1942 rose until 1946. However between these wars, the Dow rose from 1924 reaching a peak of 150 in 1930 then fell until in 1932/33 it bottomed at about 15. That is a 10x drop over 3 years. It is also obvious to see on Chart 2 the subsequent recessions when the Dow fell.
Note the decreasing amplitude of the rallies and selloffs. By far the biggest excursion of the Dow from its mean value was during the Great Depression years. Never again was this type of excursion repeated. One factor in this is the human mind. As time proceeded the expansion of credit grew exponentially and so did prices. Those have the effect of suppressing the real uninflated value of the stocks and therefore the Dow was suppressed for most of 1932 to late 1996 when it significantly broke through its mean value.
The GFC depression is particularly obvious on this chart. Ten years before was a period of very cheap money, which boosted the Dow until it crashed in 2008 right through its mean value. But even that period was an illusion which vanished as the reality of the sub-prime mortgage backed securities became real. The GFC saw the Dow drop from 56 to 28 as priced in 1914 dollars, which is a 2x drop compared to 10x during the Great Depression.
It then took a nearly 11-year bull run for the Dow to reach its next maximum in 2020 when the COVID pandemic was released on the world. It took all that time to reclaim its pre-GFC peak of 56 in December of 2019.
From 2014 to 2024 the Dow only three times dropped to its mean value, where it found support. The question is what happens next? When does the next crash hit?
In the following Chart 3, I compare on the same log-linear plot the Dow index with the Fed liabilities, both in the same 1914 dollars.

From Chart 3 we can see the correspondence between the Dow and the Fed Liabilities over the past 110 years. The 1930-1932 Great Depression stands out. So does the period 1935 to 1960 centred on World War II. As the Fed liabilities were expanded and contracted so too we see the decline in the value of the Dow and its recovery back to the mean value.
However during the period 1970 to 1997 when the Dow tanked there was little change in the Fed liabilities. From Chart 4 it appears that the smart investors pulled their money out of stocks and put it into gold during those years. See below.
Prior to 2008 the Fed liabilities indicate a depression before GFC collapse (discussed above) after which began the money printing of QE1, QE2 and QE3. Then finally the central banksters had to find an excuse for QE4 helicopter money to keep deflating the currency unit. The expansion of the line of credit follows the exponential growth curve (2) in Chart 3. This is a typical Ponzi scheme characteristic.
Currently the Dow remains above its mean value, and since dollar devaluation is at its maximum, it must numerically represent an all-time ‘high’ in the Dow index. Yet in reality in 2000 and 1930 the index was higher than in 2020. But now we are back to the same real value for the Dow as in 2020.
My view is that because of the exponential growth in the Fed liabilities and M2 currency creation, each round of the stock market maxima and minima are in real terms lower and lower. Never can the equities ever reach the same heights as before because the monetary base is being constantly devalued.

Now look at the price of gold versus the Dow index as shown on Chart 4, on a log plot. It shows that there are times when the price of gold moved opposite to the Dow. That is like saying the smart money moved from the stock market into gold and vice versa during those periods. Note how the blue and red data flip but also get progressively smaller in amplitude. That is necessarily a factor of the price inflation, which is stripped out of these data.
After coming off the gold standard (1971) it took a few years to decouple the dollar from gold, but by 1972 gold took off while the Dow continued its descent, which really started in the mid 1960s. That bear market continued until around 1985 when the bull market began after the gold price peaked. Note that during recessions the two move together but otherwise they move in opposite fashion.
From 1997 to 2006 the Dow peaked when the gold price bottomed. After the GFC of 2008 the gold price peaked after the Dow had reached its low. Not until 2017 did it recover from the GFC crash.
Since 2017 the gold price and the Dow index have moved together except during the COVID pandemic years 2020/21. After that they have been tracking together.
The big question is, what happened next? Will the gold price break through its triangle it is being wedged into? That is, break through the line (1) as we approach the apex in 2026.
Consider this! The Fed has been contracting credit with Quantitative Tightening (QT) for a year and a half now and the currency supply has nearly shrunk back (curve (2) in Chart 1) to meet the exponential growth curve (1). To keep the Ponzi scheme alive the Fed must fire up the printing presses again (wars are a good excuse) and print according to the exponential curve (1) in Chart 1. That has the effect of suppressing both the price of gold and the Dow. In Chart 4 the real gold price is manipulated to stay beneath the descending line (1).
If anything Chart 4 tells us is that as price inflation is ramped up through “money printing” the real value of stuff (stocks, bonds, real estate etc) is reduced. Even the real price of gold is suppressed compared to the peak value it reached in the early 1980s.
But like all Ponzi schemes this one is in unstable equilibrium like the rocks-stacked-on-rocks analogy pictured above. Or maybe walking a tight rope is a better picture. It is fiat currency creation that controls both monetary and financial systems. The Dow and the price of gold are now poised to diverge from each other again.
Currently the Dow is at 56 in 1914 dollar terms. That is the same value as prior to the GFC depression. So, if 1930 and 2008 are anything to go by, when the Dow peaked both times before it crashed, the same is soon to happen. The Dow will crash by a factor of 2x, meaning down to half its current value. (It is better to see that on the linear scale plot of Chart 2.)
Concomitant to that the real price of gold will either hold its value, in 1914 dollars, or even appreciate in value as it has in the past. By how much it is hard to know. If it breaks free completely from its triangle, we get the crack-up boom as hyperinflation sets in and the dollar dies. And the Fed prints like crazy bringing down the global monetary system of all the central banks with it.
We sure live in interesting times!
Recommended Reading
- Book: Apocalypse Now: On the Revelation of Jesus Christ
- Book: Merchants of Death: Global Oligarchs and Their War On Humanity
Follow me
- Telegram.org: @GideonHartnett
- Facebook: Gideon Hartnett
- X (Twitter): @gideon195203
To be notified by email put your email address in the box at the bottom of your screen. You’ll get an email each time we publish a new article.

Click this image to make a secure Donation (Stripe) !