Manufacture mega-amounts of fiat ‘money’ and it malevolently makes a monetary mountain of madness. The mountain of ‘money’ mobilizes the masses to buy in the market causing the prices to increase. Too many money units pursuing too few goods and services makes for maddening price inflation and failing prosperity.
Whereas the standard line is that price inflation is caused by greed, wages growth, too much spending, climate change, ‘vaccine’ hesitancy, and everything else except the thing that actually causes it.
Previously I tested the hypothesis that price inflation is caused by the issuance of credit by central banks by comparing the rate of growth of M2 currency supply to CPI inflation and referencing to the historical prices of gold, silver and crude oil. Here I extend that analysis by looking at the historical global prices of a few metals, lead, uranium, zinc and copper and compare their prices to gold and silver prices.
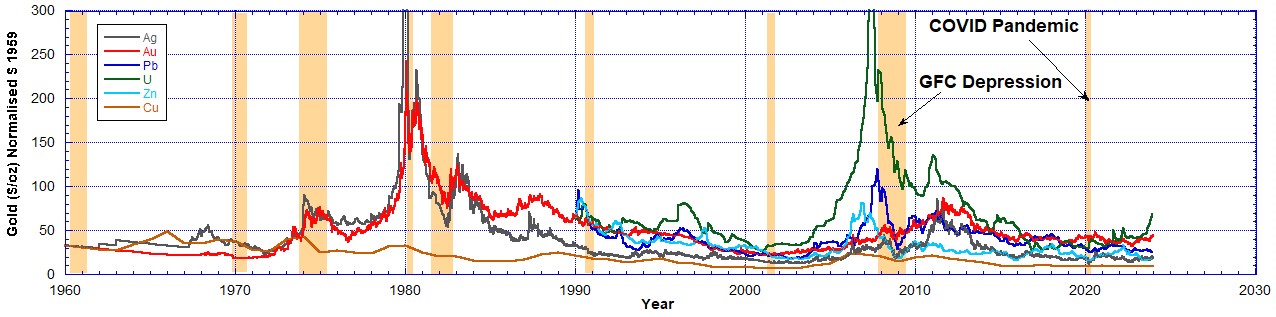
The fact that the effects of inflation can be stripped out of the nominal prices of these metals using the US Fed M2 currency supply indicates that that was the cause of the monetary madness all along. In Chart 1 the global prices of gold, silver, lead, uranium, zinc and copper are all compared. All are initially priced in 1959 dollars to strip out any price inflation caused by the issuance of M2 currency.
To display their prices this way silver and copper prices are scaled to the 1959 gold price and lead, uranium and zinc are scaled to the 1990 gold price. Because they are not in the same units of weight (but ounces, metric tons and pounds) the comparison is merely qualitative, not quantitative. Nevertheless one can easily see that there is very little trend, i.e. generally no rising price as a function of time. Of course this is if we ignore the strong peaks in price increases at certain times.
One striking feature is that uranium seems to behave like the precious metals with a massive price hike in 2007. Also it is climbing again at the end of 2023.

A better way to make a comparison between the metals is by displaying their prices as a fraction of their price in 1990. Thus in 1990 their prices are all equal to unity, and at any other time their prices are some multiple of that 1990 reference price for each metal. Multiply this by 100 and it would show a percentage change from the reference value in 1990 of 100%. This is what is shown on Chart 2.
Using this method we can now make a quantitative comparison between the metals, but expressed as the fractional change in their prices. Any price above the line equal to unity is a real increase and any price below unity is a real decrease with respect to the price in 1990. The 1990 reference price was arbitrarily chosen, but chosen because I could only get the data for lead, uranium and zinc from that year.
From Chart 2 it follows the prices of gold (red) and silver (grey) have been essentially stable, but the price of copper (orange) in real terms has been decreasing for the past 65 years. Less data was available for the other metals but it looks like zinc (light blue) is decreasing, lead (dark blue) is stable, and uranium (green) is increasing. In the last year uranium has shown a strong price growth, probably due to the green energy policies, and the need to fuel nuclear power stations.
Silver has decreased a little compared to its 1959 price but gold has held its value over the past 65 years. Silver is undervalued by a factor of two but could still serve as a monetary metal again. Gold’s price stability makes it the best choice of a money. I believe it will be that again very soon.
Another way to describe this situation is fraud. Price inflation by whatever means is fraud. Fiat currency is not money but central bank debt notes and their constant supply expansion causes all commodities, goods and services to continually inflate in price. Only by stopping the printing and getting back to using real money, gold and silver, can this problem be solved.
The malevolent mainstream makers of monetary madness have managed to manipulate the massive mortgage (death contract) of money owed. When manifest in the marvellous demise of the all-mighty moribund dollar the metals will make massive amounts more than ever expected.
Currently all price increases are totally due to the fraud of fiat money printing. It is a total fraud, a giant Ponzi scheme.
Recommended Reading
- Book: Apocalypse Now: On the Revelation of Jesus Christ
- Book: Merchants of Death: Global Oligarchs and Their War On Humanity
Follow me
- Telegram.org: @GideonHartnett
- Facebook: Gideon Hartnett
- X (Twitter): @gideon195203

To be notified by email put your email address in the box at the bottom of your screen. You’ll get an email each time we publish a new article.

Click this image to make a secure Donation (Stripe) !