Currently the price of an ounce of gold is hanging around $2020 to $2050 and an ounce of silver $20 to $25. However 110 years ago an ounce of gold and silver were $20 and $0.50, respectively. This means gold and silver have appreciated in value by about 100x and 50x, respectively.

Chart 1 shows the nominal price of gold and silver in US dollars over the years indicated. The data are for prices from 1915 to the end of 2023. Before the gold window (exchangeable to dollars) was closed ‘temporarily’ by President Nixon in August 1971 the price of gold remained within the $20 to $35 band. After that it exploded and has been rising ever since.
Silver was demonetized on February 12, 1873 when it was no longer exchangeable for dollars. During recessions the price of silver falls, especially noticeable during the Great Depression, but it rose during world wars. We are now in the beginning stages of World War III (from 2014 US overthrow of the government in Ukraine) so we should expect the silver price to rise again soon.
During past wars the gold price held firm and now it is holding firm or rising in the period I have indicated as WWIII. In fact since 2014 the price of gold has been in a bull run.
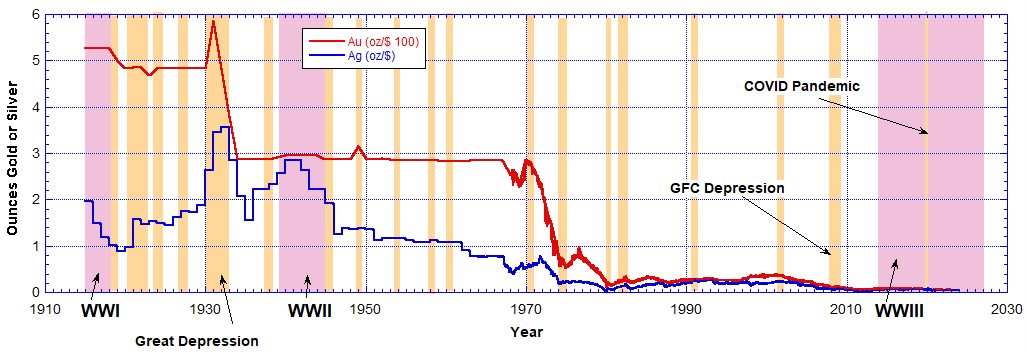
Chart 2 presents how many ounces of gold could be purchased for $100 and how many ounces of silver could be purchased for $1 from 2015 to 2023. Quite obviously amount of metal you could buy has fallen to very close to zero after 110 years.
This Chart tells us one thing, that is, that the value of the dollar has fallen to nearly nothing. This exposes the fraud. The fraud is that real money is gold and silver. Paper fiat currency is not money. It has been deliberately deflated since 1915 even though gold was exchangeable for dollars up to 1971.
The banksters call gold a ‘pet rock’, but it has intrinsic value that this Chart exposes. Fiat currency has no intrinsic value. Since all fiat currencies have always sunk to their intrinsic value, the US dollar and hence all currencies, which are based on it, will go to zero also. Chart 2 and 3 are showing us this fact.

Chart 3 is the data data as Chart 2 but on a log scale vertical axis. This helps us see the detail in the years after 1971.
In the year 2024 a dollar will buy the least amount of gold or silver in all history. So far the only exception to that is in 2011 but any time now gold could be revalued and the amount a dollar buys as shown on this Chart 3 will dip even further towards zero.
How long can you divide down an ounce of gold or silver? Well a lot more if past hyperinflationary scenarios are anything to go by. But those past financial and monetary systems all died in their last inflating currency boom of their time. Now the dollar is dying exponentially as indicated by Chart 3.
The take home message here is the simple truth that the fraud of the past 110 years is clearly exposed. Gold and silver are real money and they expose the fiat dollars as what they are, just failing promissory notes. Whole nations have been deceived by this and fought world wars to keep the Ponzi scam going.
Recommended Viewing
Rumble.com Video: Former Morgan Stanley Director Says There Are No Free Markets Anywhere: It’s All Manipulated
Recommended Reading
- Book: Apocalypse Now: On the Revelation of Jesus Christ
- Book: Merchants of Death: Global Oligarchs and Their War On Humanity
Follow me
- Telegram.org: @GideonHartnett
- Facebook: Gideon Hartnett
- X (Twitter): @gideon195203
To be notified by email put your email address in the box at the bottom of your screen. You’ll get an email each time we publish a new article.
Click this image to make a secure Donation (Stripe) !