
This analysis looks at the Nikkei 225, an index of highly liquid stocks on the Japanese stock exchange. I compare that index to the Dow Jones Industrial Average (DJIA) after the effects of inflation have been stripped out using the M2 currency supply in their respective economies.
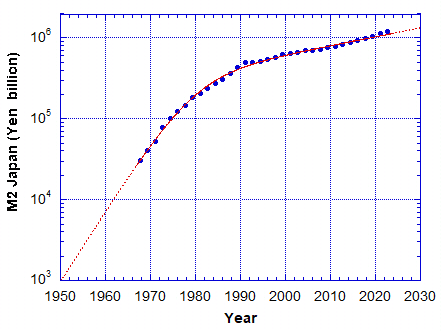
Chart 1 shows the Japan M2 currency supply from January 1, 1967 to January 31, 2024. Only a few percent of data points are shown. It is apparent the trend line has an inflection point around 1990, where the slope changes. The red curve is the sum of 2 exponential curves to fit over the whole domain. I have extended the fit to 1950 in order to use it to normalise the Nikkei index to 1959 Yen. See Chart 3.
If the M2 currency supply growth results from “money printing”, credit creation by the central banks, then the inverse, the reciprocal of M2 must represent the value of the currency at any moment of time. It is this curve that the index (Nikkei or DJIA) is multiplied by to normalise it to Yen or Dollars at a fixed date. Therefore over its domain the dollars or yen are of the same value.
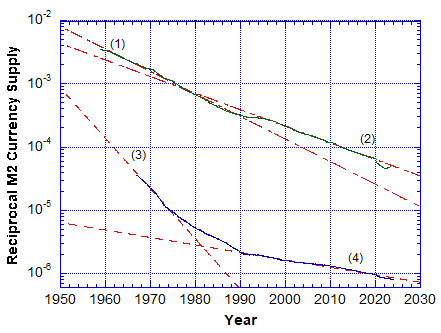
In Chart 2, the top green curve is the reciprocal of the US M2 currency supply and the bottom blue curve is the reciprocal of the Japan M2 currency supply. The units on the vertical scale are 1/$ for the US M2 and 1/Y for the Japan M2 supply. It is very apparent that the real value of these currencies rapidly approach zero. Fiat Ponzi scheme “money printing” will eventually collapse with the fraud.
On a log plot a straight line is an exponential curve. The US M2 supply can be represented fairly well with a single exponential, but as shown there are two domains before and after 1990 where two different curves (1) and (2) could be used. However the Japan M2 supply cannot be approximated with one exponential. I have used 2 curves (3) and (4) which fit well before and after 1990. The fitted curve in Chart 1 is the sum of curves (3) and (4).
Using the blue curve ((3)+(4)) from Chart 2 to normalise the nominal Nikkei index to 1959 Yen we get the result in Chart 3.
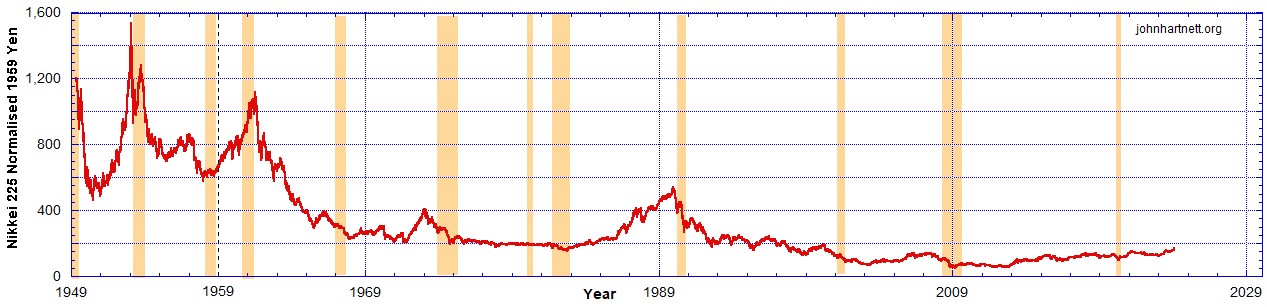
From this we see that the effects of M2 currency expansion have been stripped out. The Nikkei has been de-inflated and as a result shows only a small downward trend reaching a bottom in 2009 after which it has been trending up. After World War II Japan’s economy was really cooking but by the end of the 1950s it has been in decline.
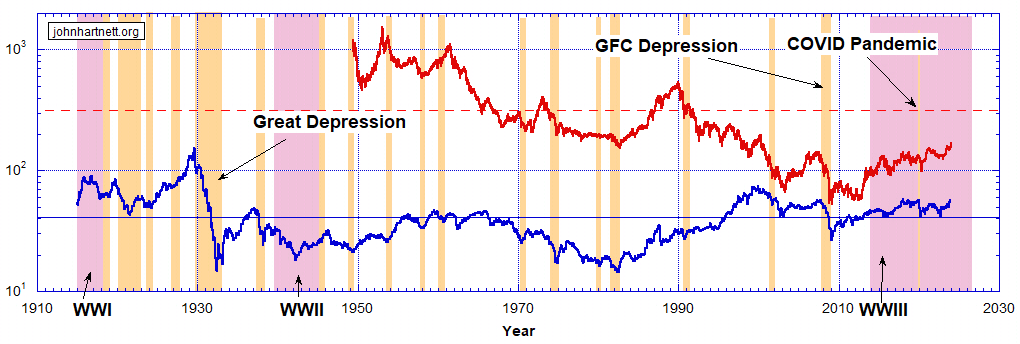
This fact is clearly demonstrated when the de-inflated Nikkei index is compared to the de-inflated Dow Jones index. See Chart 4.
Since about 2000 one can notice a strong relationship between the Nikkei and the Dow. Yet since then the Nikkei has been on an upward trend whereas the Dow has been stagnant, only moving sideways. Over longer times, since 1950 the Nikkei has fallen in real value by about a factor of 10. Over the same period the Dow Jones has risen by about a factor of 30. So I am not surprised that Japan has slipped in its status from the second biggest economy.
Recommended Reading
- Book: Apocalypse Now: On the Revelation of Jesus Christ
- Book: Merchants of Death: Global Oligarchs and Their War On Humanity
Follow me
- Telegram.org: @GideonHartnett
- Facebook: Gideon Hartnett
- X (Twitter): @gideon195203

To be notified by email put your email address in the box at the bottom of your screen. You’ll get an email each time we publish a new article.

Click this image to make a secure Donation (Stripe) !