
As we were expecting the prices of both gold and silver have broken out from their respective lines of resistance. Where will they fly to now? Some commentators predict a moon shot or two.
Thus I thought it would be very interesting to update my previous analyses on this where I chart the historical prices of these precious metals in the same dollar units, i.e. by comparing, in effect, ‘apples with apples’.
That means by stripping out the deflationary effects on the US dollar resulting from the expansion of the M2 currency supply we can compare the gold and silver prices all in the same value dollars.
In the following I present an update on the real price of gold and silver in 1959 dollars, calculated by stripping out the effect of dollar devaluation, where, in both metals, we see a price break out above the line of resistance.
The only assumption is that real price inflation is caused by expansion of the M2 money stock. This is not the same as CPI inflation, which significantly and fraudulently underestimates real prices.
For an introduction to the method I used please first read When Gold’s Real, Uninflated Price Breaks Out.
The M2 currency supply was downloaded from the Board of Governors of the Federal Reserve System (US), M2 [WM2NS], retrieved from FRED, Federal Reserve Bank of St. Louis; https://fred.stlouisfed.org/series/WM2NS, October 22, 2024.

Chart 1 presents the real price of gold ($/oz) from January 1960 to October 2024. The straight line (1) is drawn to touch the peaks in 1981 and 2011. But as you can see the price of gold broke through that resistance line (1) in February 2024. This is a price break out in real value terms with reference to the 1959 price of $35.10/oz.
The peak value of gold in 1980-81 was the result of coming off the gold standard in 1971. The peak in 2011 occurred because of the global meltdown in 2008 called the GFC Depression.
The next peak has to be different. The gold price has broken through the resistance line (1) and it also can be traced to a cause. That is, the COVID Pandemic of 2020 with the Fed’s massive helicopter money printing. Under conditions of massive monetary inflation investors look for safe havens for their wealth. In this case, it is gold.
How high will the real price of gold go this time? Perhaps to the moon?

Chart 2 is a zoomed in look at the same gold price data from Chart 1 but for the period after January 2020. Note that the straight line (2) represents the value of an ounce of gold in 1959, equal to $35.10.
The price of gold was last officially set at $42.2222/troy oz in 1973. It has not changed, not even by a small amount. I calculated this number from the listed total USD value in all US Treasury vaults divided by their total listed weight. The result actually has 7 sig. figures of precision, i.e. $42.2222000/troy oz. See What is Money? Who Controls It?
I have drawn that statutory price of gold on Chart 2 using line (3). Interesting isn’t it that the price break out from the resistance line (1) occurred just as the real price of gold approached the official statutory value of $42.2222/oz.
But the gold price has now gone where it has rarely gone before. Now they’ll have to revalue all the gold in Fort Knox (if they can find any).
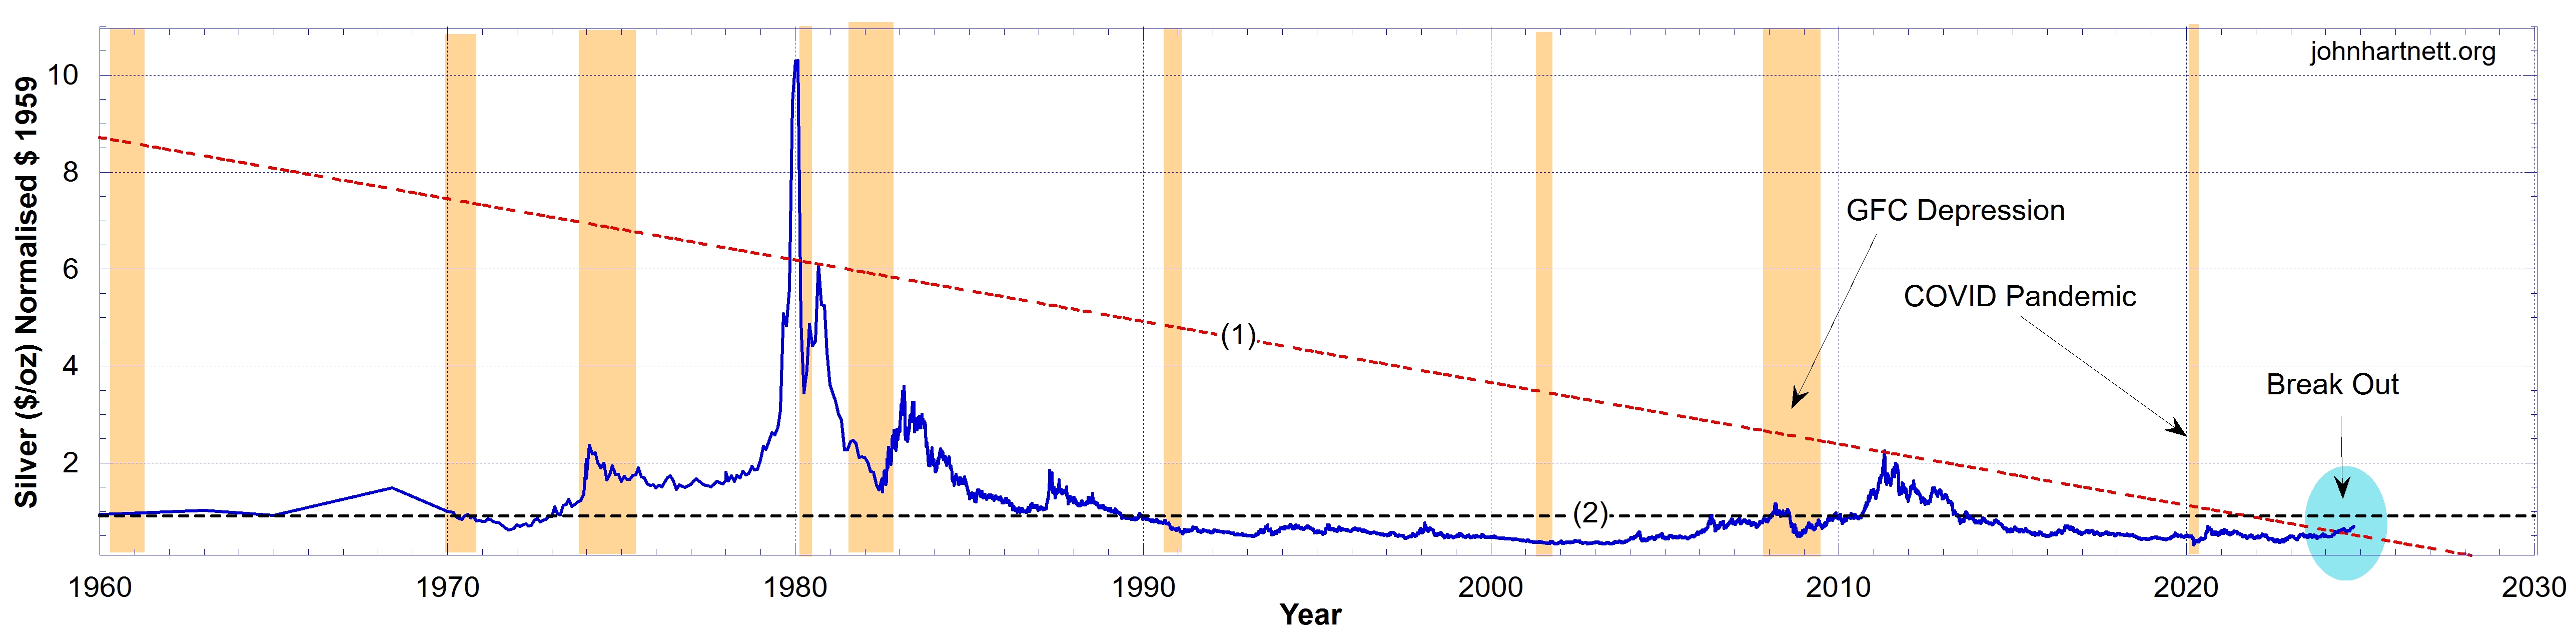
The exact same procedure was applied to the silver price resulting in Chart 3. A resistance line (1) has been breeched by the silver price in 1959 dollars. The same cause and effect can be applied as was applied with the gold price.
There is one obvious difference. The inflation-stripped-out price of silver per ounce has been tracking around $0.40 to $0.60, which is significantly below the 1959 price of $0.90. As previously noted, silver is significantly undervalued.
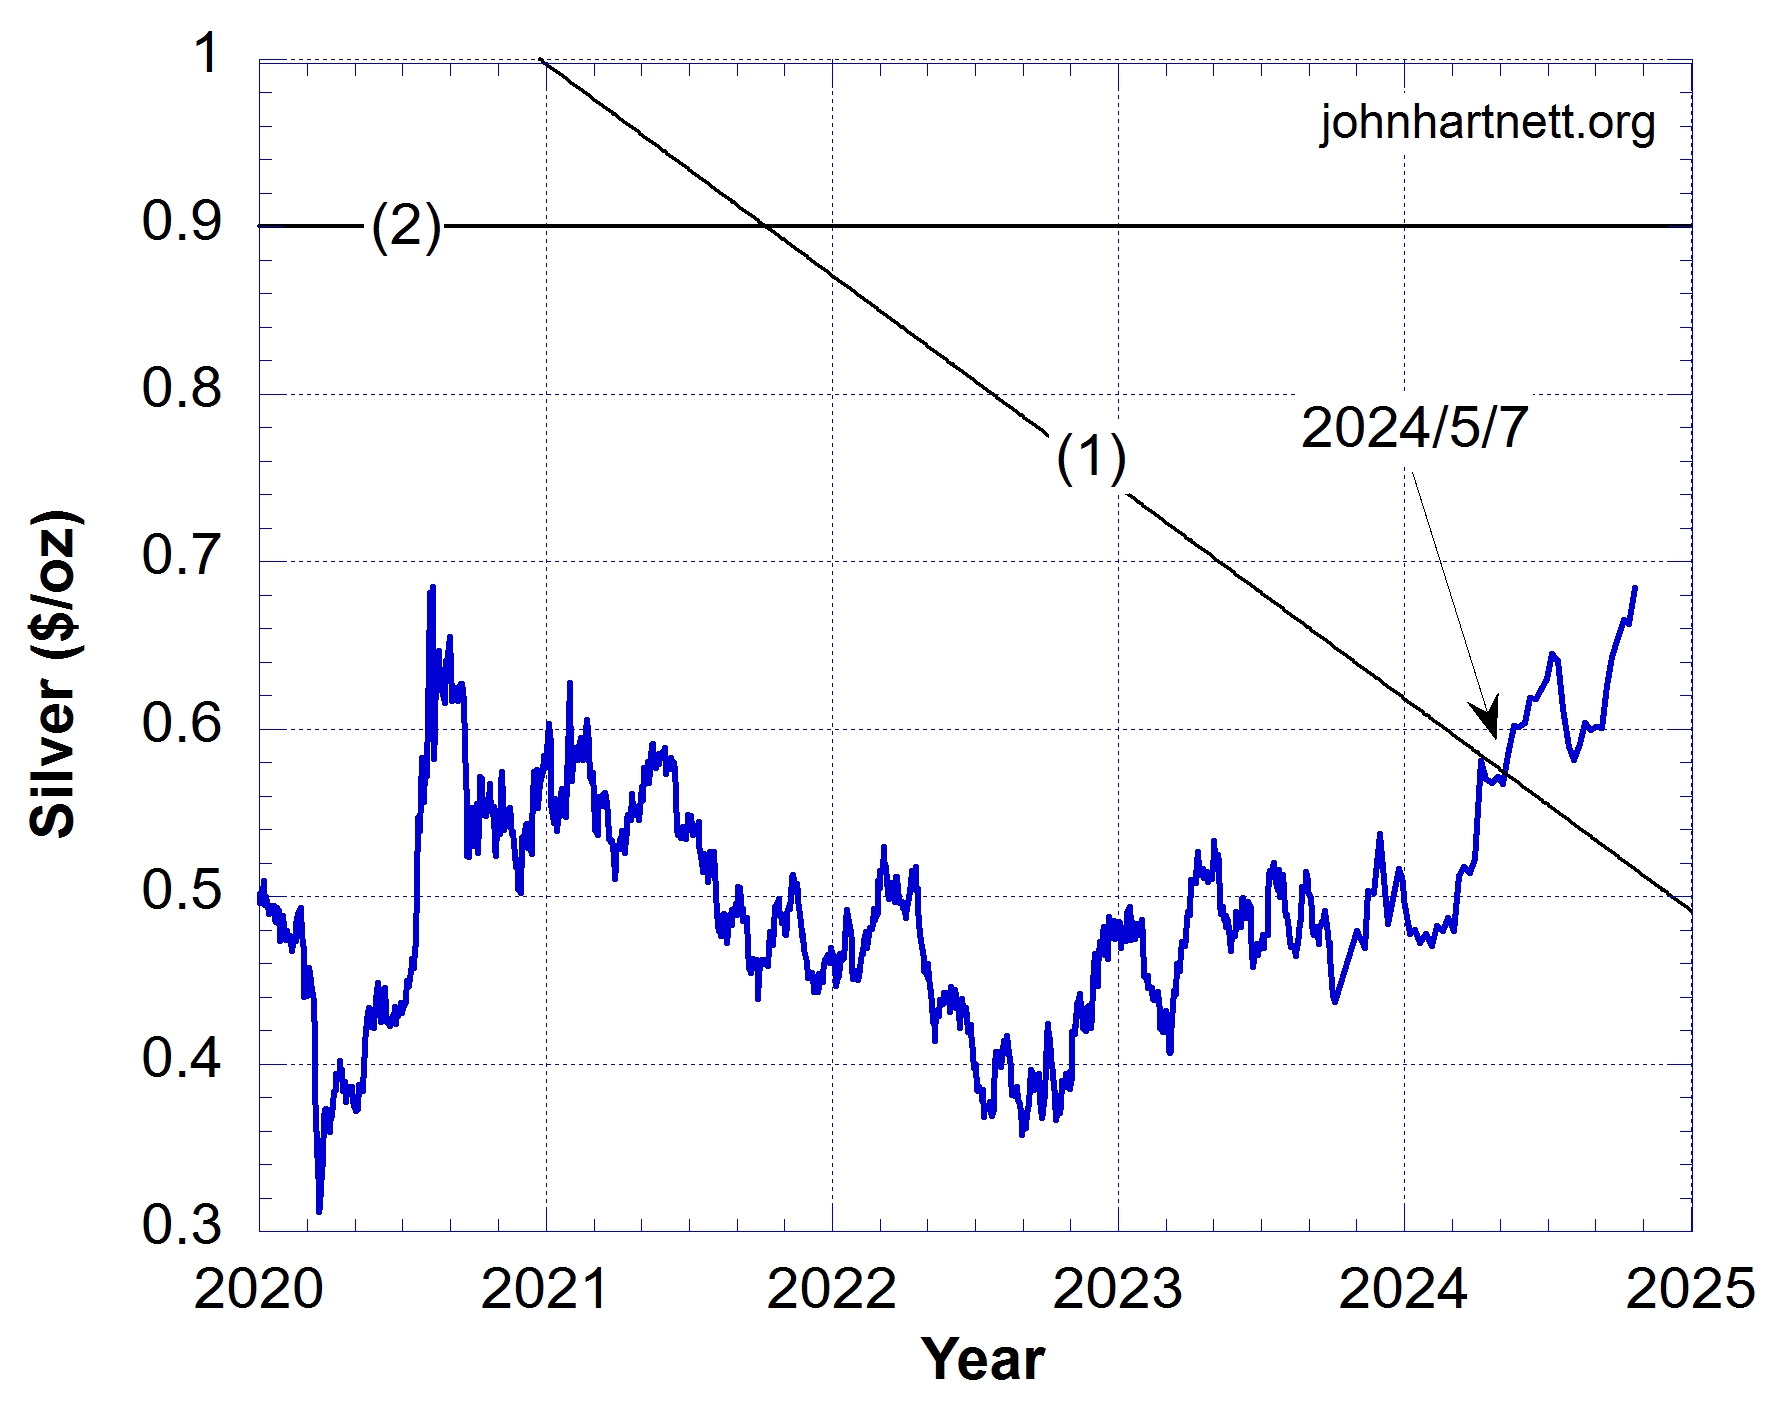
Chart 4 is a zoomed in look at the same silver price data from Chart 3 but for the period after January 2020. Note that the straight line (2) represents the value of an ounce of silver in 1959, equal to $0.90.
Since about 2015 the silver price has been below the true price of $0.90/oz in 1959 dollar terms. This should mean silver has a massive upside potential.
Finally silver’s price broke through the resistance line (1) in May of 2024 and it is looking like it is getting ready for a moon shot. I am hoping it is so. It has been a long time coming, but since it has broken through the real resistance line there should be no stopping it now as we approach the endgame and the death of dollar.
Related Reading
- Inflation Compared to the Prices of Gold and Silver Exposes the Theft
- When Gold’s Real, Uninflated Price Breaks Out
- What is Money? Who Controls It?
- Gold and Silver Herald the Collapse of the Dollar
- The Coming Crack-Up Boom
- Silver in the Crack-Up Boom
- Update: Gold and Silver Prices Above Predictions
Follow me
- Telegram.org: @GideonHartnett
- X (Twitter): @gideon195203
To be notified by email put your email address in the box at the bottom of your screen. You’ll get an email each time we publish a new article.
Click this image to make a secure Donation (Stripe) !