
Today is one week since the state of Israel, with the support and backing of the US, launched an unprovoked aggression against Iran, bombing and killing civil and military leadership and some senior scientists. Iran responded with wave after wave of hundreds of missiles, successfully hitting many targets in Tel Aviv and Haifa. Nothing like this has ever occurred before to Israel. Now they have an enemy that hits back.
Over this weekend, according to some reports on the web, it is expected that President Donald Trump will decide if the USA will enter this war as direct combatant on Israel’s side. If the US does that Iran has promised to severely punish them by striking Gulf oil facilities and US bases stationed in the Gulf states. That could cripple all the oil supplies that pass through the Strait of Hormuz, treble oil prices and plunge the global economy into a devastating depression.
But the global economy is already bankrupt and the international banksters need World War III to get them out of the massive black hole they are in. The war already started years ago but they need to ramp up the spending on weaponry and military materiel to “inflate” the US currency to create the appearance of liquidity and prosperity, when in fact the opposite is actually true.
The true picture is found in the price of gold. In Chart 1 the price of 1 oz of gold is shown since 1964. It is compared to what would be expected if it only increased by the fraudulent CPI increase (curve (1)). But we know the government fudges those figures.
The more telling comparison is with the true value of “inflation”, actually monetary devaluation, due to the increase in the supply of currency and credit. I have calculated what 1 oz of gold should be if based on the M2 currency supply expansion since 1964 (curve (2)).
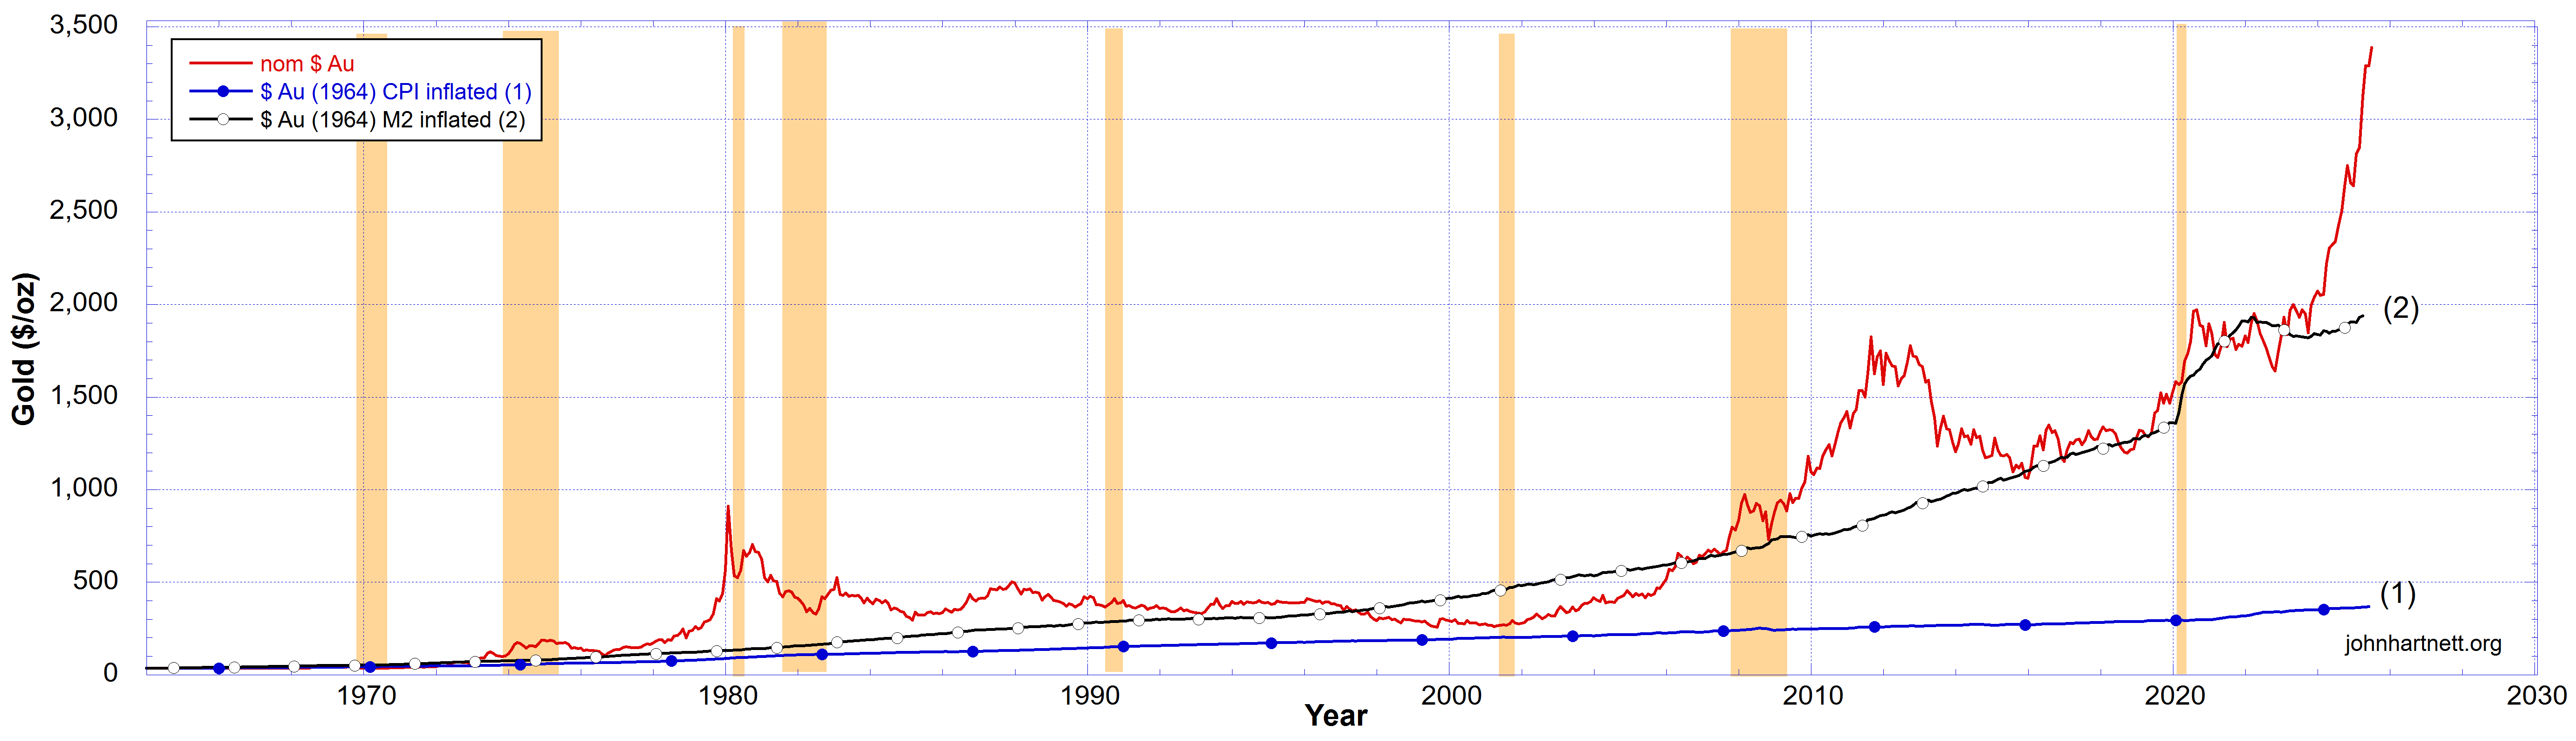
Some features are worth noting. After 2008 and the quantitative easing (QE1, QE2 and QE3) “money printing” the nominal price of gold exploded but came back down by 2015, after which it constantly has increased. By 2020 the COVID plandemic was instituted to get the central bankers out of trouble again.
A faked global pandemic was used as the pretext for another round of “money printing” QE4, totalling something like $3 trillion. Notice the correlation between the gold price and the expected price based only on real dollar deflation due to the M2 currency supply expansion (curve (2)).
From mid 2023 the price of 1 oz of gold has departed from the true “inflation” trend line (curve (2)) and increased in real terms. This seems to be signaling the expectation of a global war we may be entering very soon.
If WWIII does ensue the price of gold will explode higher and higher, not just because of the Western nations devaluing their currencies, but because of the “safe haven” status gold affords.
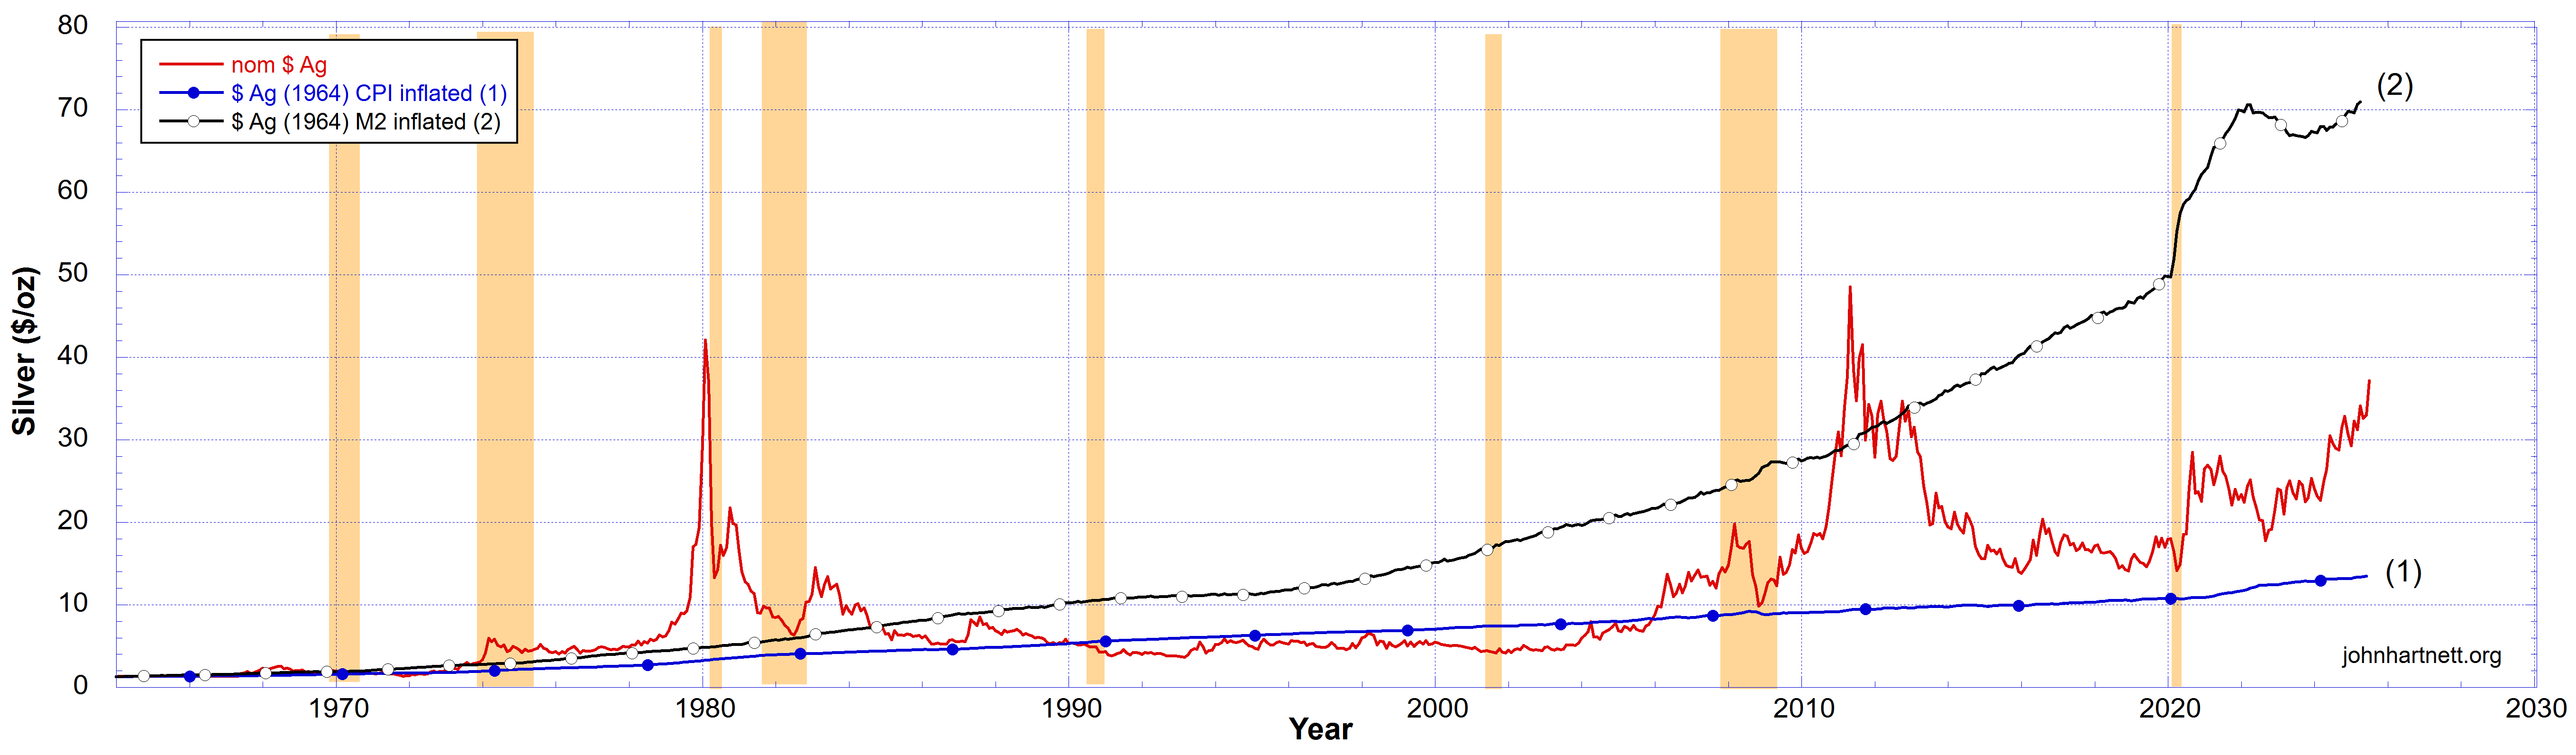
Now look at the price of 1 oz of silver over the same time period, shown in Chart 2. Here also the silver price is compared to that expected from the fraudulent CPI (curve (1)) and from the M2 expansion of the currency and credit supply (curve (2)).
Currently silver is shown to be heavily undervalued in nominal US dollars. It is above that expected from the CPI index but well below that from the M2 expansion of the money supply. Thus today the nominal price of silver should really be closer to $70/oz.
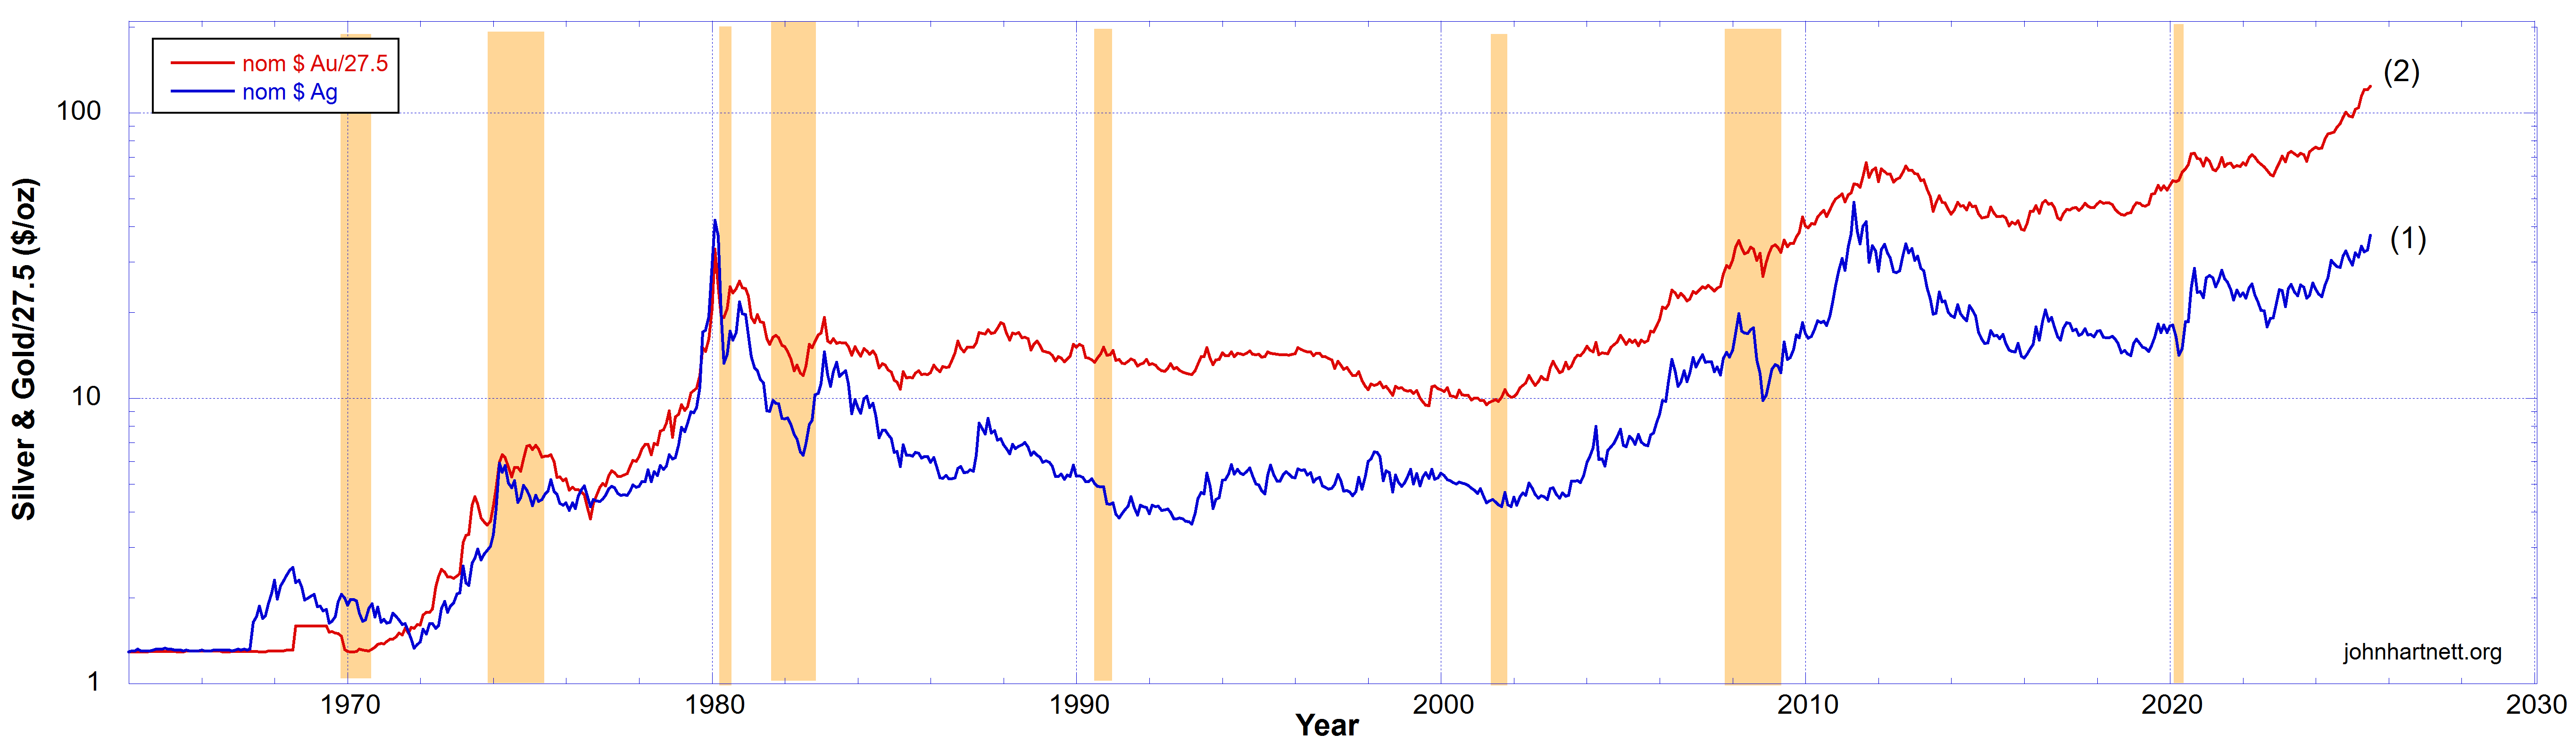
In Chart 3 I compare the prices of gold and silver on the same chart using a log Y axis. To do this the gold price was scaled by a constant 27.5 so that in January 1964 it is equal to the $1.29 price of silver.
From 1964 to 1980 gold and silver prices are well correlated. That is their fractional or percentage changes are approximately equal. But after 1980 gold pulls away from silver though there is still some measure of similarity. Silver has been significantly undervalued since 1980.
Lastly I compare the prices of gold and silver with the Dow Jones (DJIA), the S&P500 and the NASDAQ in Charts 4 and 5. Both charts also use a log Y axis.

In Chart 4 the Dow Jones (DJIA), the S&P500 and the NASDAQ are appropriately scaled to equal the $1.29 price of silver in January 1964. This allows us to see how they performed compared to each other. Over the whole period since 1964 the NASDAQ (brown) outperformed the other indices and gold and silver.
In Chart 5 the Dow Jones (DJIA), the S&P500 and the NASDAQ are appropriately scaled to equal the $5.47 price of silver in January 2000. From this chart it is obvious that gold (red) and silver (blue) both outperformed all of these three indices. In particular gold (red) has outperformed them by a significant amount.
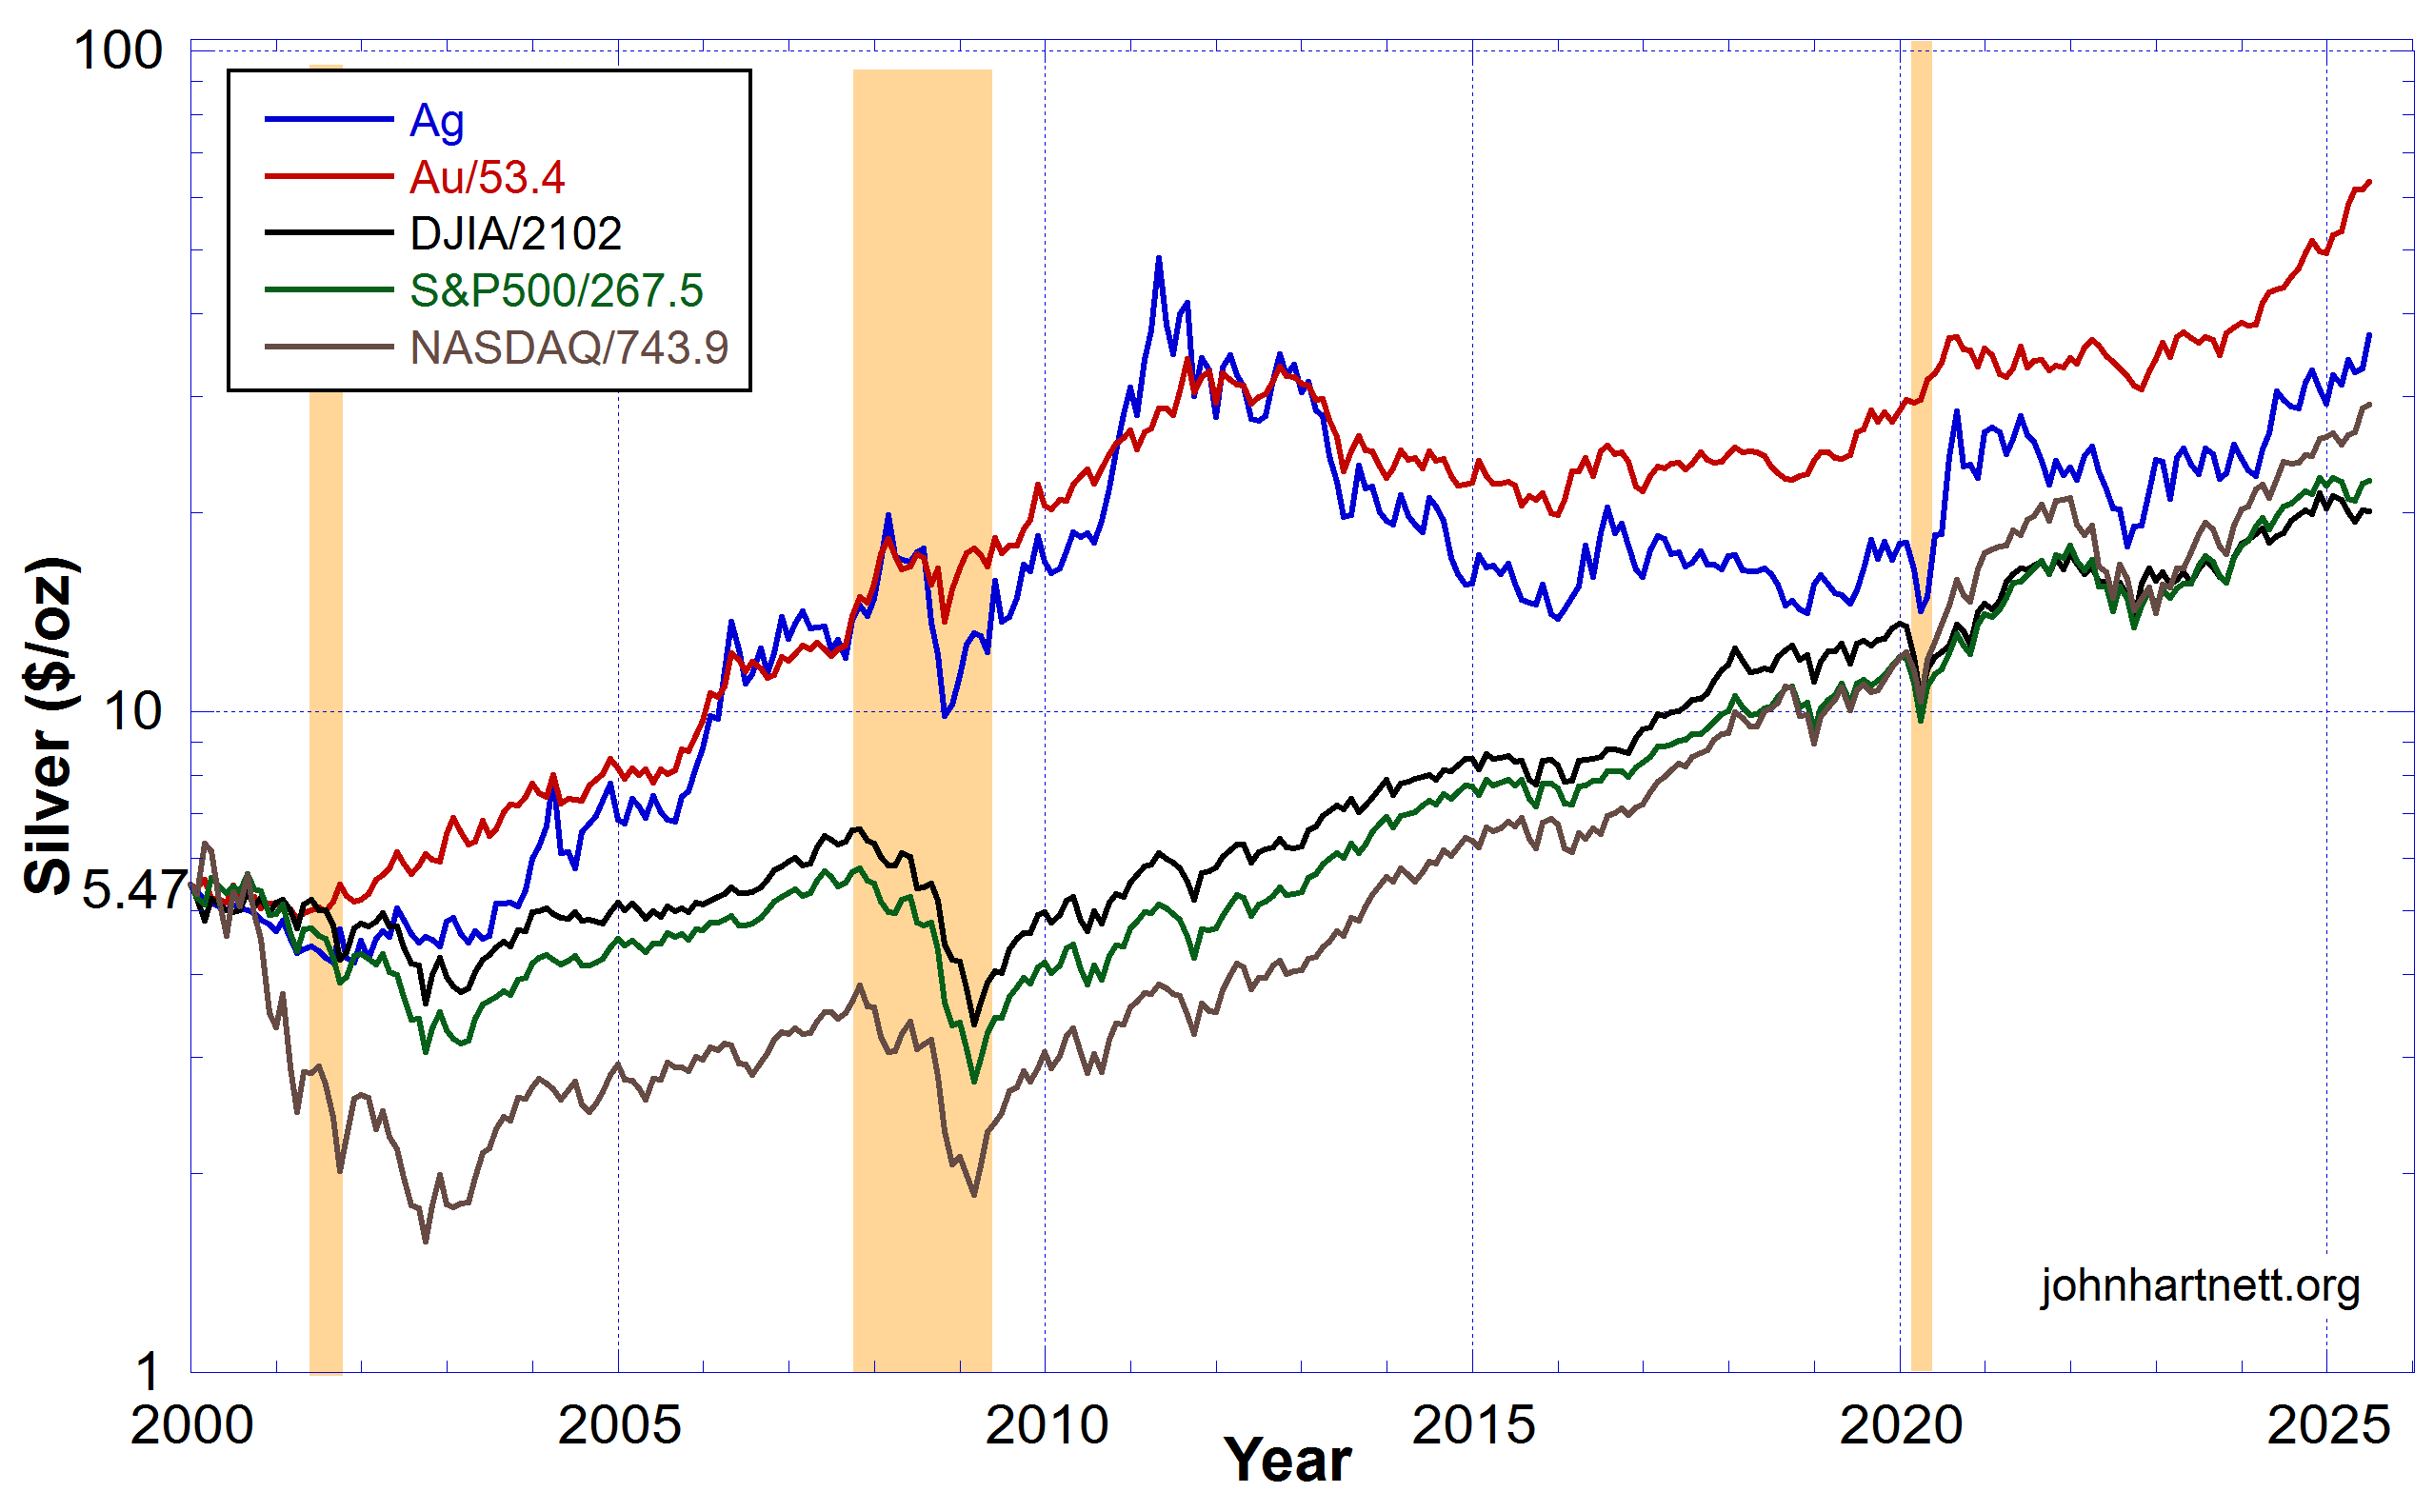
Gold (red) has really shined in the past 25 years and is set to continue to do so. But silver (blue) is starting to lift its game also.
Now… add a new kinetic world war and the “money printing” must explode as nations churn out all the munition and materiel needed to burn up on the battle field.
When inflating a balloon the amount of balloon rubber is unchanged even though it expands in size due to the added air. In the same manner the central banksters inflate the “money supply”, which means massive devaluation of the currencies of their countries, but they are all derivatives of the US dollar as the world reserve currency.
Add the Iran v Israel/US war to the Russia v Ukraine/NATO war with other countries like China/North Korea/Pakistan (all nuclear armed nations) joining in and what do you get? World War III and dollar devaluation leading to massive gold and silver price hikes, in nominal dollar terms.
Related Reading
- World War III Has Begun (at Least Against the Currency)
- Wake Up World! World War III Has Begun!
- Why World War III?
- All Wars Are Banksters’ Wars
- Mike Maloney: 30 Seconds to Midnight, Global Financial Collapse Soon
- Control Global Energy, Food and Money and You Control All Humans
Free Subscribers
Subscribe to our Newsletters as a Free Subscriber and be notified by email. Just put your email address in the box at the bottom of your screen.
You’ll get an email each time we publish a new article. It is quick and easy to do and totally free. You only need do it once.
Premium Subscribers
Subscribe to our Newsletters as a Premium Subscribers at $5 USD/month or $30 USD/year (you choose).
Paid Premium Subscribers will get exclusive access to certain content I publish. That will only cost you a cup of coffee per month.
Also you’ll be able to download, for free, a PDF of my book Apocalypse Now and also a PDF of my book Physics of Creation The Creator’s Ultimate Design for Earth.
You can download them from the link below.
This is how you can support my work. I have been publishing this website for 10 years now and up to 2024 I never asked for any support.
Press the button “Premium” on the front page to find a list of Premium content. Thanks so much to all supporters.
At a minimum, please join as a Free Subscriber. It’ll cost you nothing. It may also help me beat the shadow banning of some posts.


Leave a comment