

Previously I have discussed the ages of the patriarchs as described in the Masoretic Text. That was to show some major discontinuity of human lifespans beginning around the time of the great Flood in Noah’s time. Here I extend that discussion using the Septuagint Text which, as previously indicated, has better agreement with the year of Noah’s Flood than does the Masoretic Text.
Read Beyond Death | Taxation and an Absolute Limit to Human Lifespan and Age as a Quality Factor of Human Life After the Flood
After doing some analysis on the change in ecliptic from Dodwell’s data and the connection to the spin axis of the Earth’s liquid core and its magnetic field strength I am led to look more closely at the Septuagint Text.
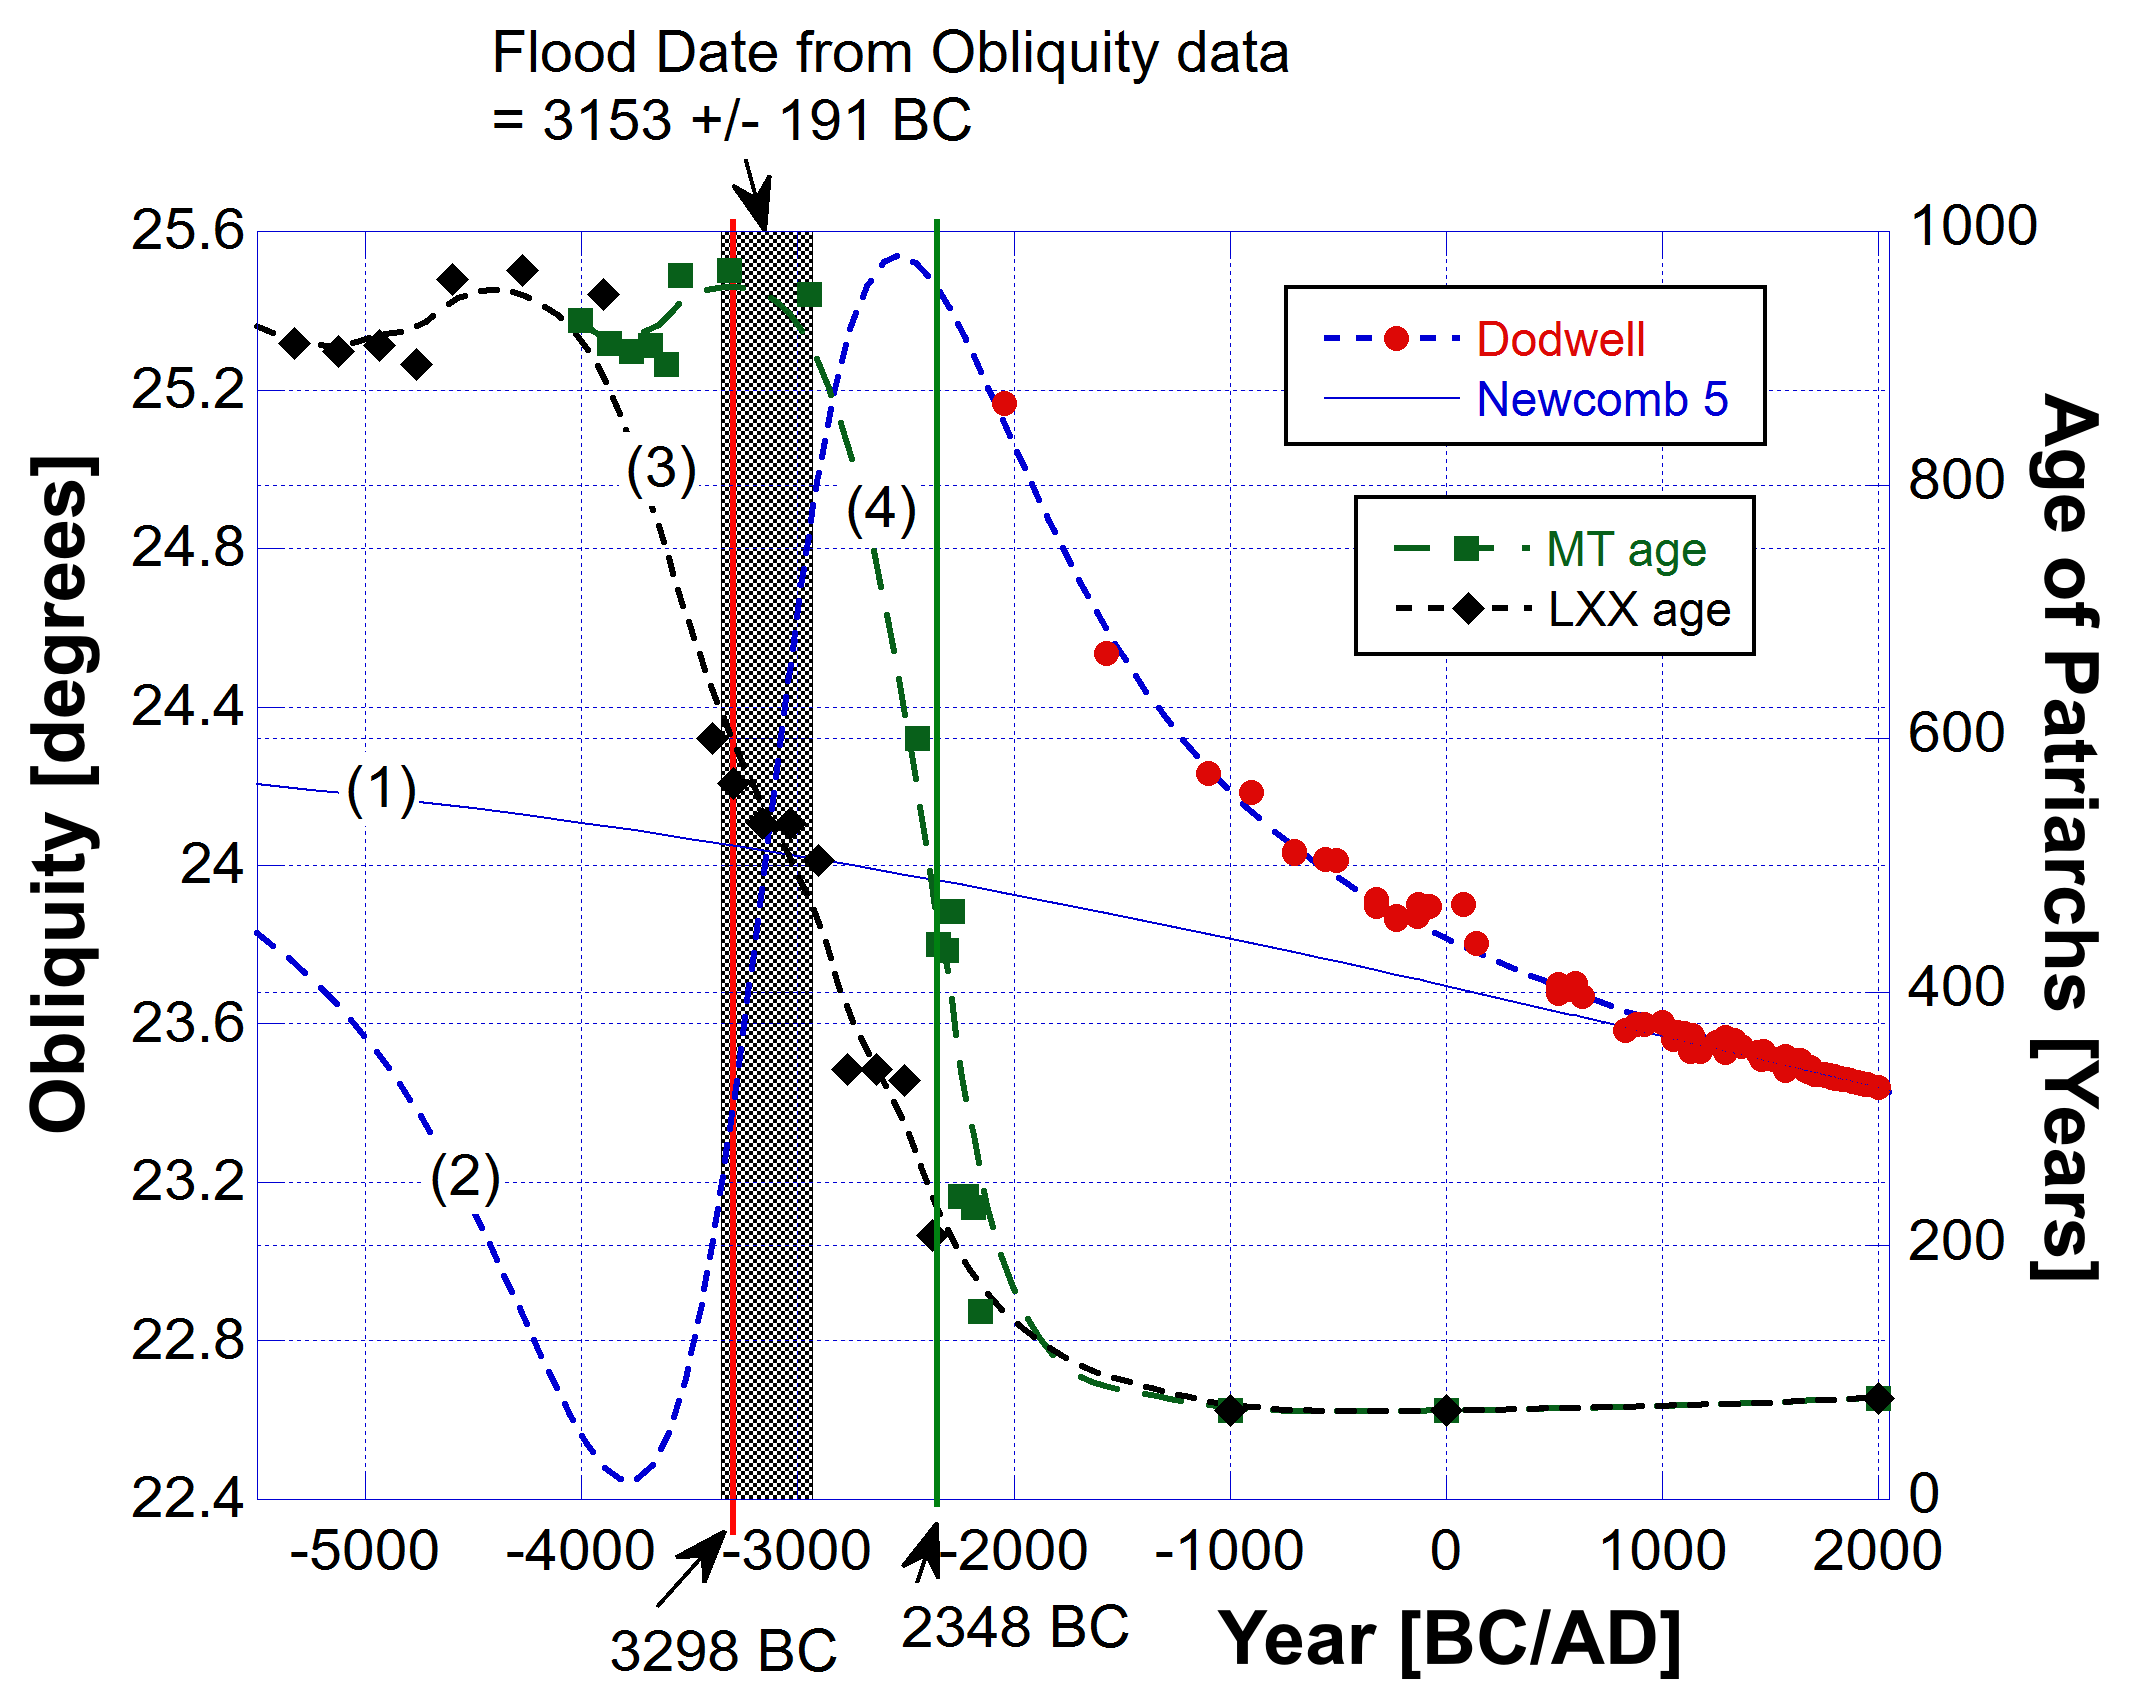
In the following I have extracted both the ages of the patriarchs as listed in the Masoretic Text (MT) and the Septuagint Text (LXX). The data was obtained from Henry B. Smith Jr, The Case for the Septuagint’s Chronology in Genesis 5 and 11, ICCC Vol. 8 (2018). From that data I have plotted in Fig. 1 the Lifespans of the patriarchs as a function of time, but plotted at the date of their birth according to the respective timelines of the texts. Note that the LXX data start at 5560 BC and the MT data start at 4004 BC.
On this doubleY plot I also show the change in obliquity of the ecliptic (tilt of the Earth’s axial rotation axis). Curve (1) is the standard Newcomb 5th order polynomial description of the change in tilt due to the gravitational effects of the Sun, Moon and planets. Curve (2) is the fit to Dodwell’s data using my Model 3 Lorentzian curve. From the Lorentzian curve fit we get a date for the Flood of 3153.9 ± 191 BC.
For an understanding of that see the list of Related Reading below. Read Can We Know the Year of Noah’s Flood? if you are short of time.
In Fig. 1 I show the region expected for the year of the Flood. The Flood date is within the greyed rectangle. The centre of the region is where my Model 3 curve (2) crosses the Newcomb 5 curve (1). Because I have no obliquity data where the modelled curve (2) changes rapidly we can only say that the Flood occurred within that region. The LXX gives a Flood date of approximately 3298 BC represented by the red vertical line. That lays within the rectangular region but my analysis decidedly excludes Bishop Ussher’s chronology from the MT with a Flood date of 2348 BC represented by the green vertical line.
The assumption I make is that the change in tilt of the Earth’s axis directly affected the change in tilt of the spin axis of the liquid core which generates the Earth’s magnetic field. Somehow the changes in the Earth’s magnetic field strength and/or the energy in the axial dipole field affected the lifespans of humans living at that time. In such a case, the change in axial tilt (obliquity) of Earth is a proxy for the as-yet-unexplained effect on human lifespans.
In Fig. 2 I isolate the most relevant data, because the MT data is now excluded.
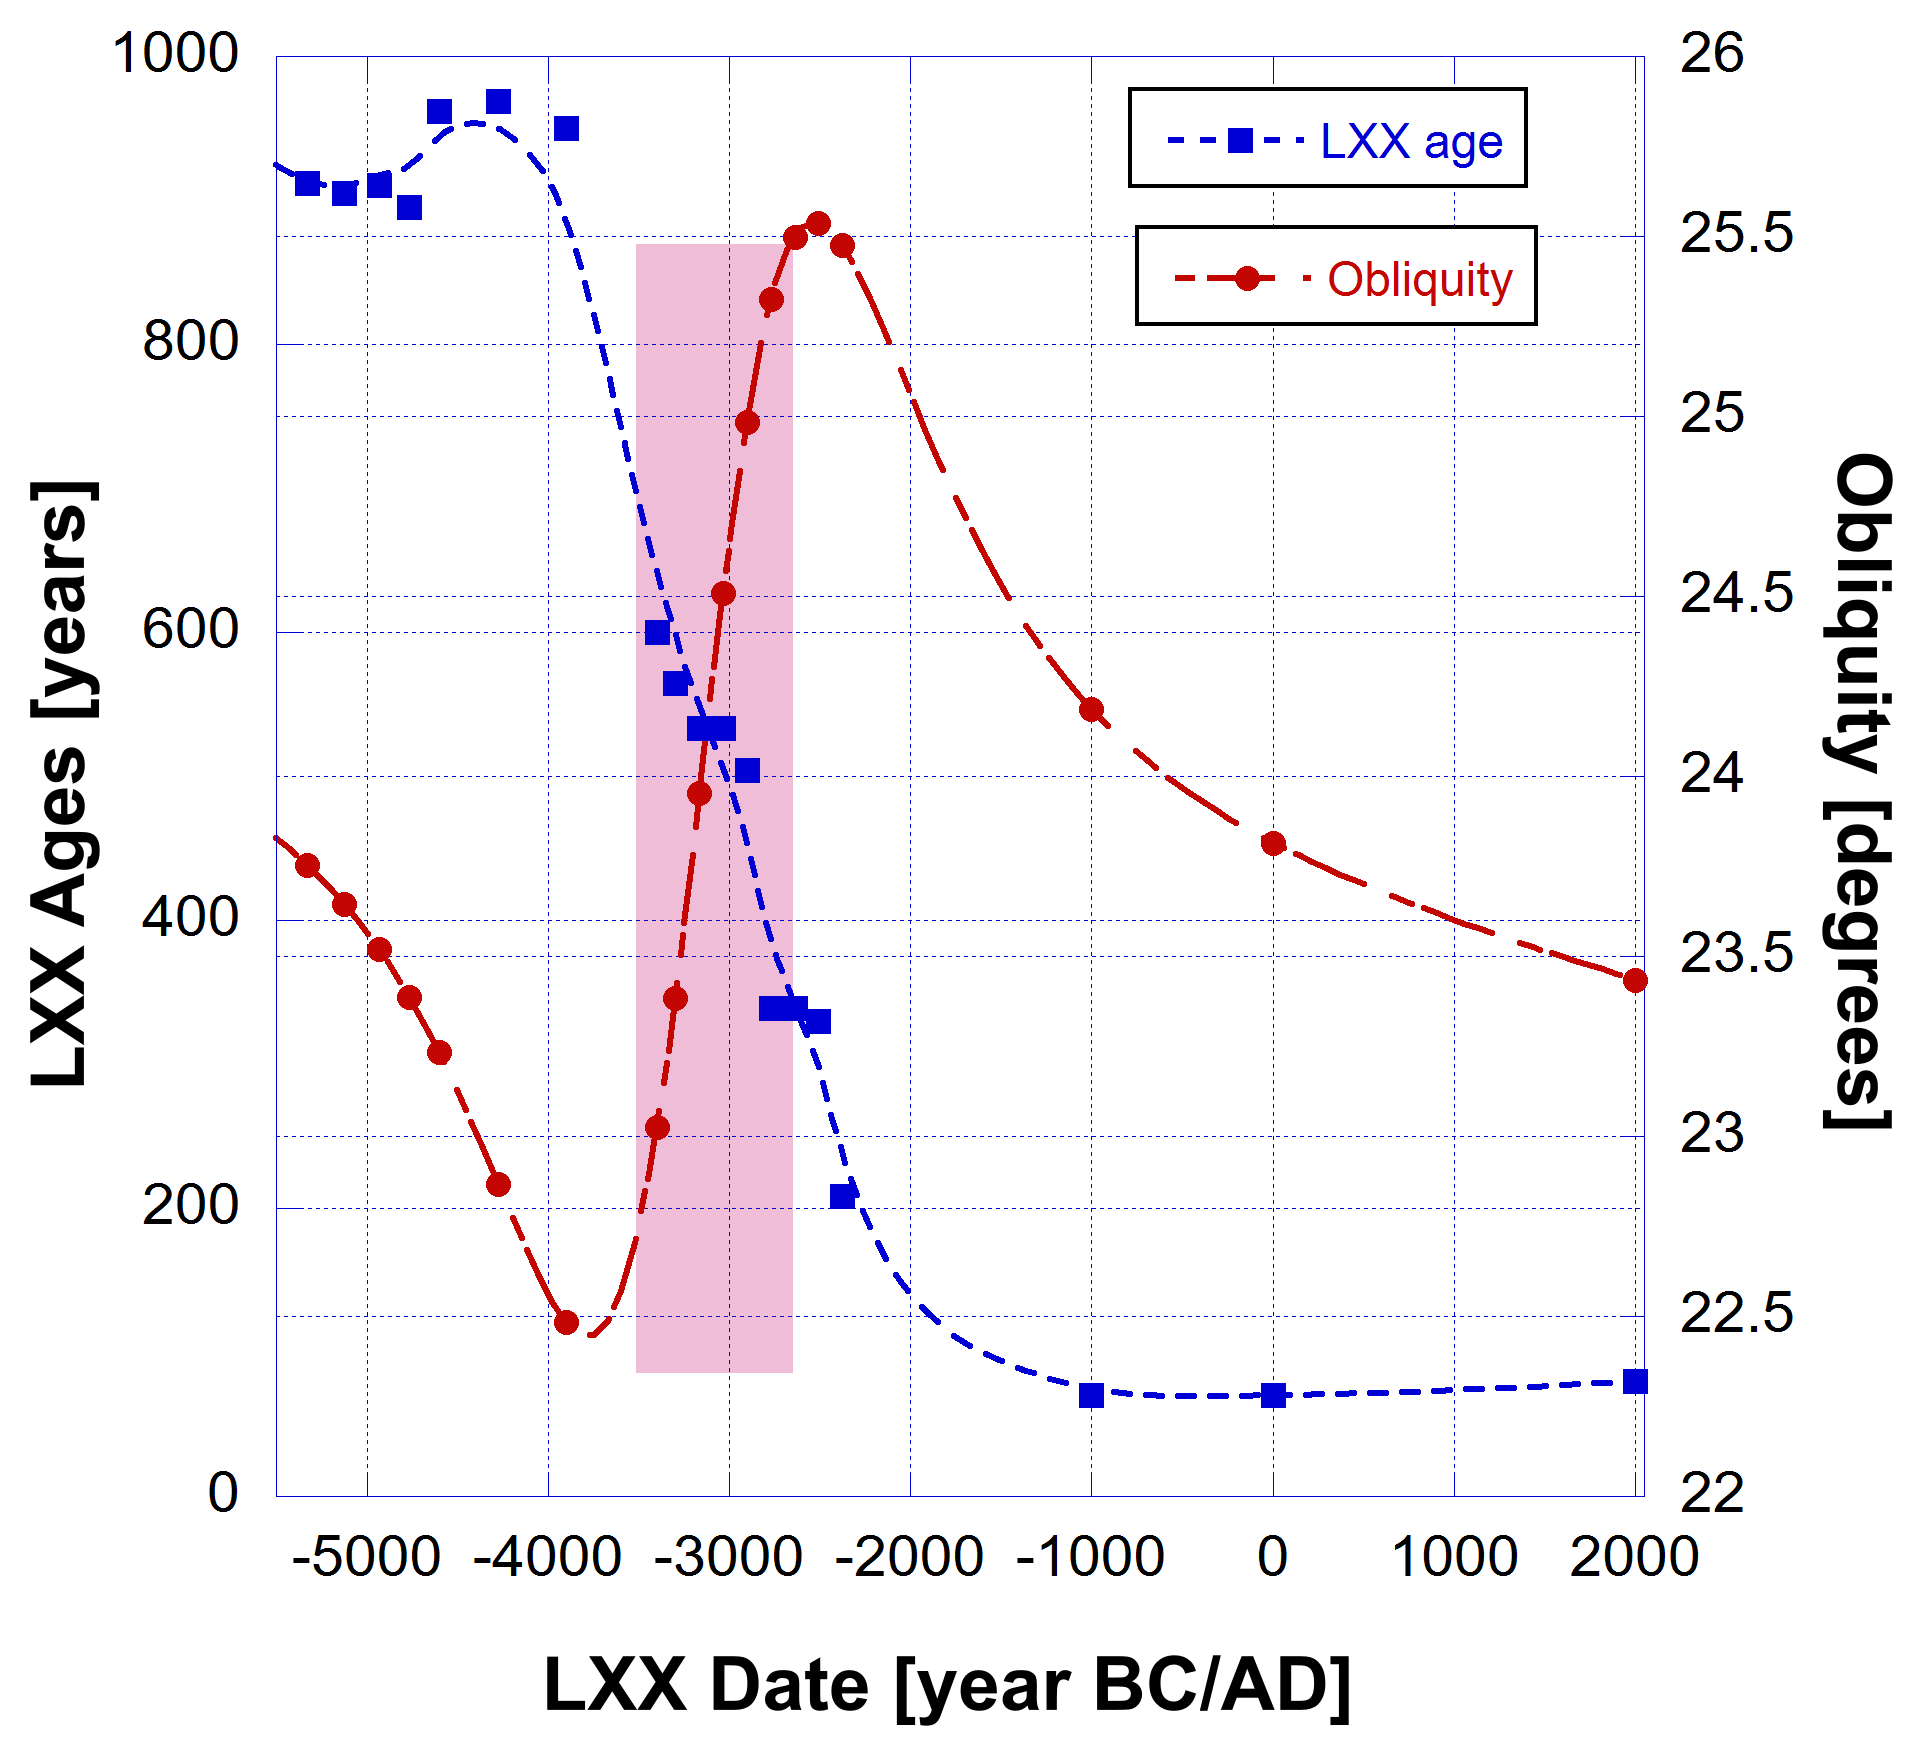
In Fig. 2 each red circle represents the obliquity (right vertical axis) in the year of birth of the patriarchs. Each blue square is the LXX lifespan of those patriarchs (left vertical axis).
In the pink rectangle it is easy to see some sort of anti-correlation between the change in tilt and the change in lifespans of the patriarchs. You’ll also notice an anti-correlation between the two curves over the time period less than 4000 BC.
If we plot the lifespans of the patriarchs against the obliquity of Earth in regions of correlation, or, in this case anti-correction, the result should be a horizontal trend line.

Fig. 3 shows these regions of anti-collection, and they are approximately horizontal. They are indicated by the top arrow (pointing left) and the third arrow down (pointing right). The latter still has a downward trend though. The arrows indicate the direction of the flow of time from creation at the top towards the present day at the bottom.
Noah’s Flood occurred somewhere before the obliquity reached 23 degrees. There is clearly a major discontinuity there when lifespans fall from 950 to 600 years. The plot in Fig. 3 is multivalued because it is not a plot of time but of change in tilt of the Earth’s axis, which I am assuming is a proxy for some effect on human lifespan.
The Lorentzian curve in Figs 1 and 2 is what we call an S-curve. In Fig. 3 this S-curve is manifest in the ages of the patriarchs as a function of obliquity in the year of their birth.
I looked at plotting their lifespans as a function of time at the midpoint of their lives and at the year of their deaths. Each curve has a similar shape. But because the patriarch lived such long lives they overlapped each other by a lot. This meant the resulting curves were not monotonic in trend and made it more difficult to illustrate the trendline. Nothing is lost by using the date of their births to plot their lifespans. You could look at it as in the year of their birth they had that potential age to live and as time approached the great Flood the age potential rolled off exponentially.
So… what does Fig. 3 tell us about the future of lifespan potential for humans?
Other than in the preFlood world, all black arrows showing the direction of time are downward in terms of lifespan. The S-curve is winding down. Thus outside of some medical improvements lifespans are not going to get greater. I am speaking generally and about the average. It looks like the human thermodynamic clock is running down.
Very long lifespans was a feature of the created world but since those times of the preFlood patriarchs the underlying physical properties for such long ages have been eviscerated. Only with the coming of the Lord Jesus Christ and His renovation of the human body can long lifespans, eternal lifespans, be achieved.
Related Reading
- Obliquity of Earth’s Axis | How Has It Changed?
- Major Changes in Earth’s Magnetic Dipole Since Creation
- Can We Know the Year of Noah’s Flood?
- Evidence of Creation | Mechanism Causing Perturbation in Obliquity of Planet Earth
- Oscillations in the Change of Earth’s Obliquity
- A Brief History of the Earth’s Magnetic Field
- Future Predictions of Earth’s Magnetic Field Strength
- The Amazing Science of Young Earth Creation
Free Subscribers
Subscribe to our Newsletters as a Free Subscriber and be notified by email. Just put your email address in the box at the bottom of your screen.
You’ll get an email each time we publish a new article. It is quick and easy to do and totally free. You only need do it once.
Premium Subscribers
Subscribe to our Newsletters as a Premium Subscribers at $5 USD/month or $30 USD/year (you choose).
Paid Premium Subscribers will get exclusive access to certain content I publish. That will only cost you a cup of coffee per month.
Also you’ll be able to download, for free, a PDF of my book Apocalypse Now and also a PDF of my book Physics of Creation The Creator’s Ultimate Design for Earth.
You can download them from the link below.
This is how you can support my work. I have been publishing this website for 10 years now and up to 2024 I never asked for any support.
Press the button “Premium” on the front page to find a list of Premium content. Thanks so much to all supporters.
At a minimum, please join as a Free Subscriber. It’ll cost you nothing. It may also help me beat the shadow banning of some posts.


Leave a comment