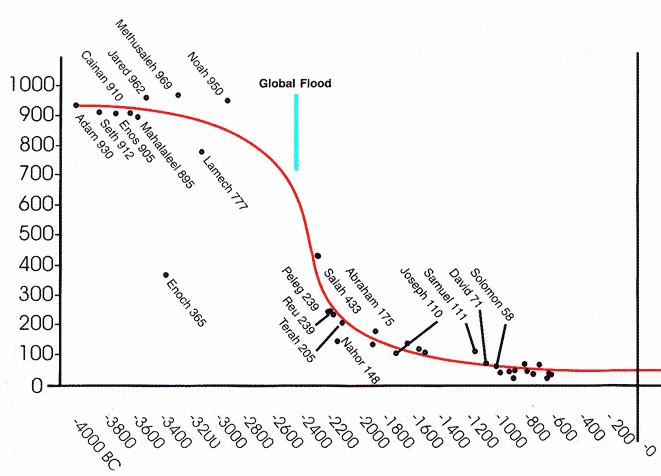
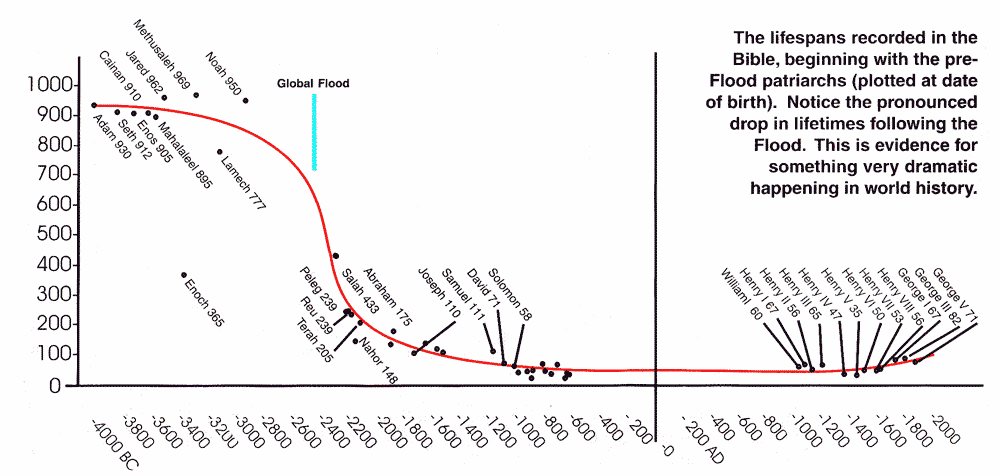
The pre Flood patriarchs lived exceptionally long lives. Even after the great global deluge the biblical records give lifespans much greater that the average today of about 70 years. The global Flood in Noah’s time was the greatest geological and geographical catastrophe Earth ever experienced. It is not surprising that significant environmental changes occurred. Those changes plus the passage of time effects of entropy on the genomes of all organisms may be the cause of the rapid decrease in ages.
Over 10 years ago I suggested a way to model all effects on lifespan using a characteristic similar to, that is analogous to, that found with the ring down time of physical systems, like a bell for example. See Age as a Quality Factor of Human Life After the Flood. In that paper I used the genealogical age data from the book of Genesis using the Masoretic Text (MT).
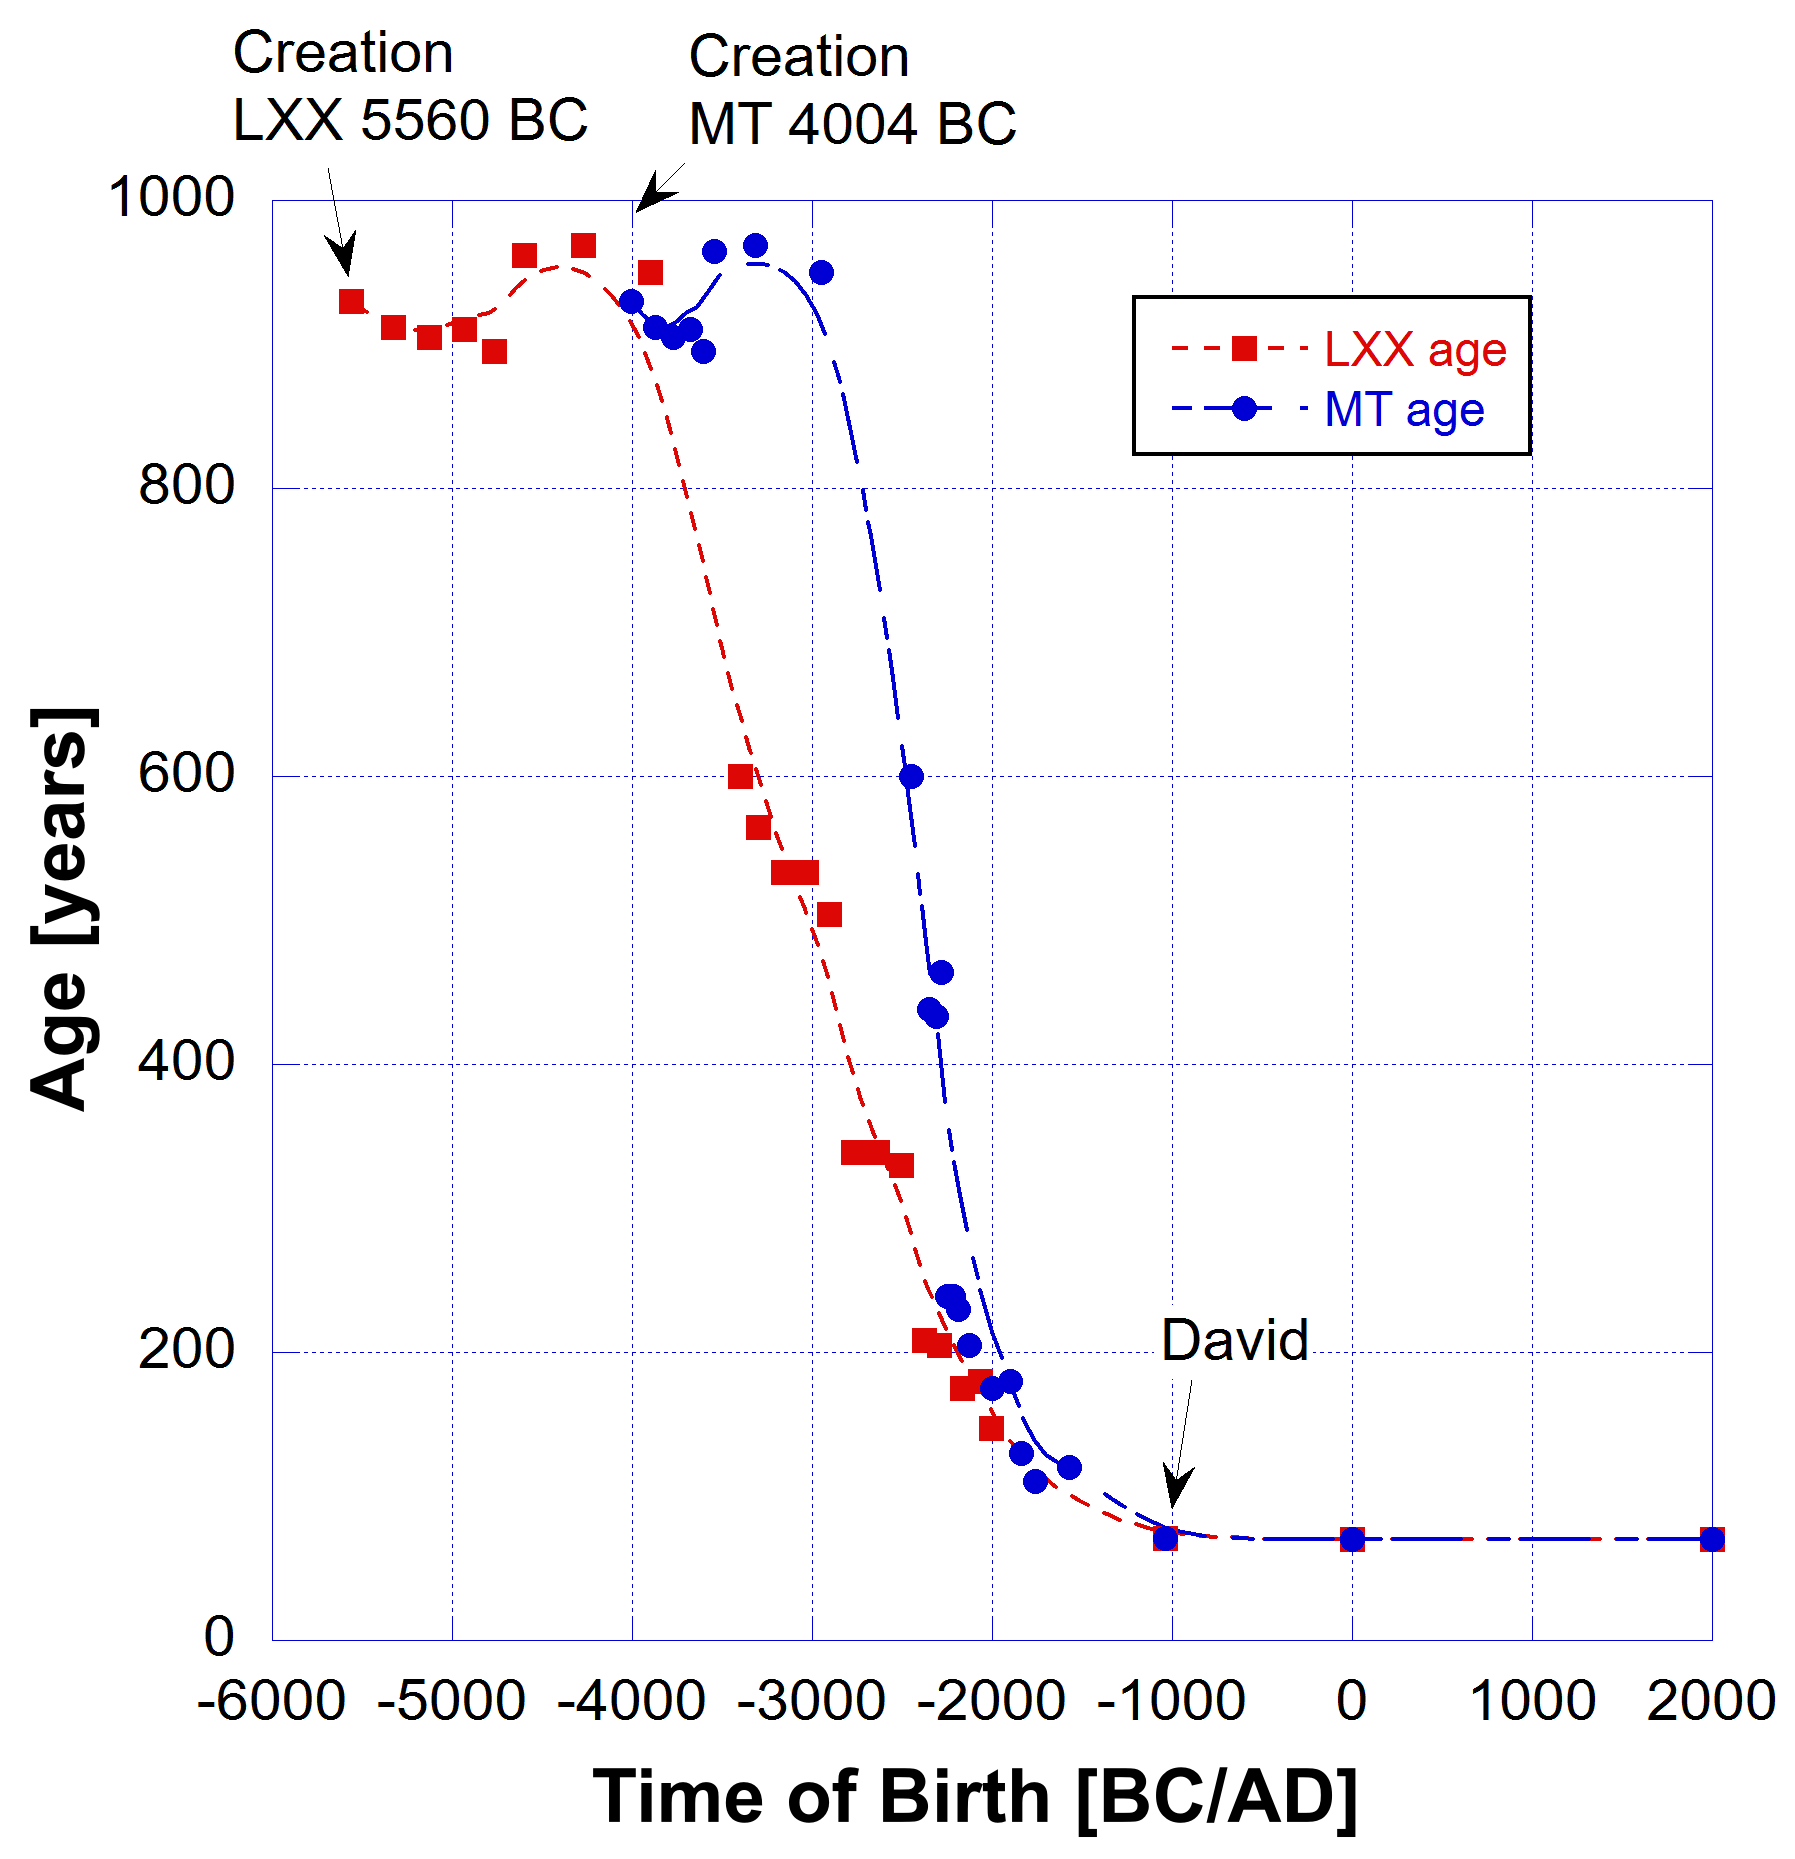
More recently I presented a seminar where I developed that same hypothesis some more but included the patriarch age data from the Septuagint (LXX). The lifespan data was derived from a paper by Henry B. Smith Jr, The Case for the Septuagint’s Chronology in Genesis 5 and 11, ICCC Vol. 8 (2018).
See the ppt video presentation What Happened After the Flood? Why Did Lifespans Decrease Rapidly?
In the following analysis I have kept essentially the same theory but use a different mathematical model and I have added more data by including the ages of Terah, Abraham, Isaac and Jacob. King David is used as before. All the data used are shown in Fig. 2.
Obviously the longevity data from MT and LXX are quite different as to when the patriarchs lived. There are also some differences in their age at death. But by the time of King David that data from LXX and MT come into agreement. For the two data points after David I have used 70 years as representative (Psalms 90:10), though there must have been some small differences around that figure. That may be indicated by the ages of the kings listed in Fig. 1 above.
A recent research paper published in 2021 Nature Communications 12, 2765, and reported on by Popular Mechanics in 2025 may give us some insight or clues. That research indicated that there is an absolute limit to human longevity and that that limit is now 150 years.
- The main factor limiting our lifespan is a loss of the ability to bounce back after a setback, called “physiological resilience.”
- Even without major health issues, like cancer, your body will eventually run out of energy to help recover from even minor challenges.
- Running out of energy and loss of physiological resilience are effects of the 2nd Law of Thermodynamics.
The research “examined both changes in blood cell counts and the number of steps the groups took, treating the two factors as “hallmarks of aging” that could help them chart the subjects’ progress (or deterioration) over several months.” (Popular Mechanics)
Despite the two variables being so different, blood cell counts and steps each decreased at a similar rate in the test subjects over time.
The researchers defined a parameter, the dynamic organism state indicator (DOSI) ε as the relaxation or recovery rate (or the inverse characteristic recovery time) which was extrapolated to zero at an age in the range 110–170 years old (at that point, there is complete loss of resilience and, hence, loss of stability of the organism state).
… the researchers were able to find the point at which the body would ultimately disintegrate as a result of the loss of resiliency. Every year, for example, think of the risk of cancer as a kind of coin toss with a certain likelihood of happening. The longer you live, the more coin flips you must take. The point at which you take that last coin flip, they say, is somewhere between 120 and 150 years—a value that likely puts a hard limit on human life. [JGH: This is an effect of the 2nd Law increase in entropy.]
“We conclude that the criticality resulting in the end of life is an intrinsic biological property of an organism that is independent of stress factors and signifies a fundamental or absolute limit of human lifespan,” the authors note in the paper.
In my model I define a quality factor or Q-factor in terms of the total losses in the system. That is
Q = 1/L, (1)
where L represents the losses in units of reciprocal age. In the case of human (or any) life the losses represent the energy lost from the system integrated over some finite period of time. This definition is in the context of senile death, not due to accident, disease or being taken by God, meaning not seeing an earthly death.
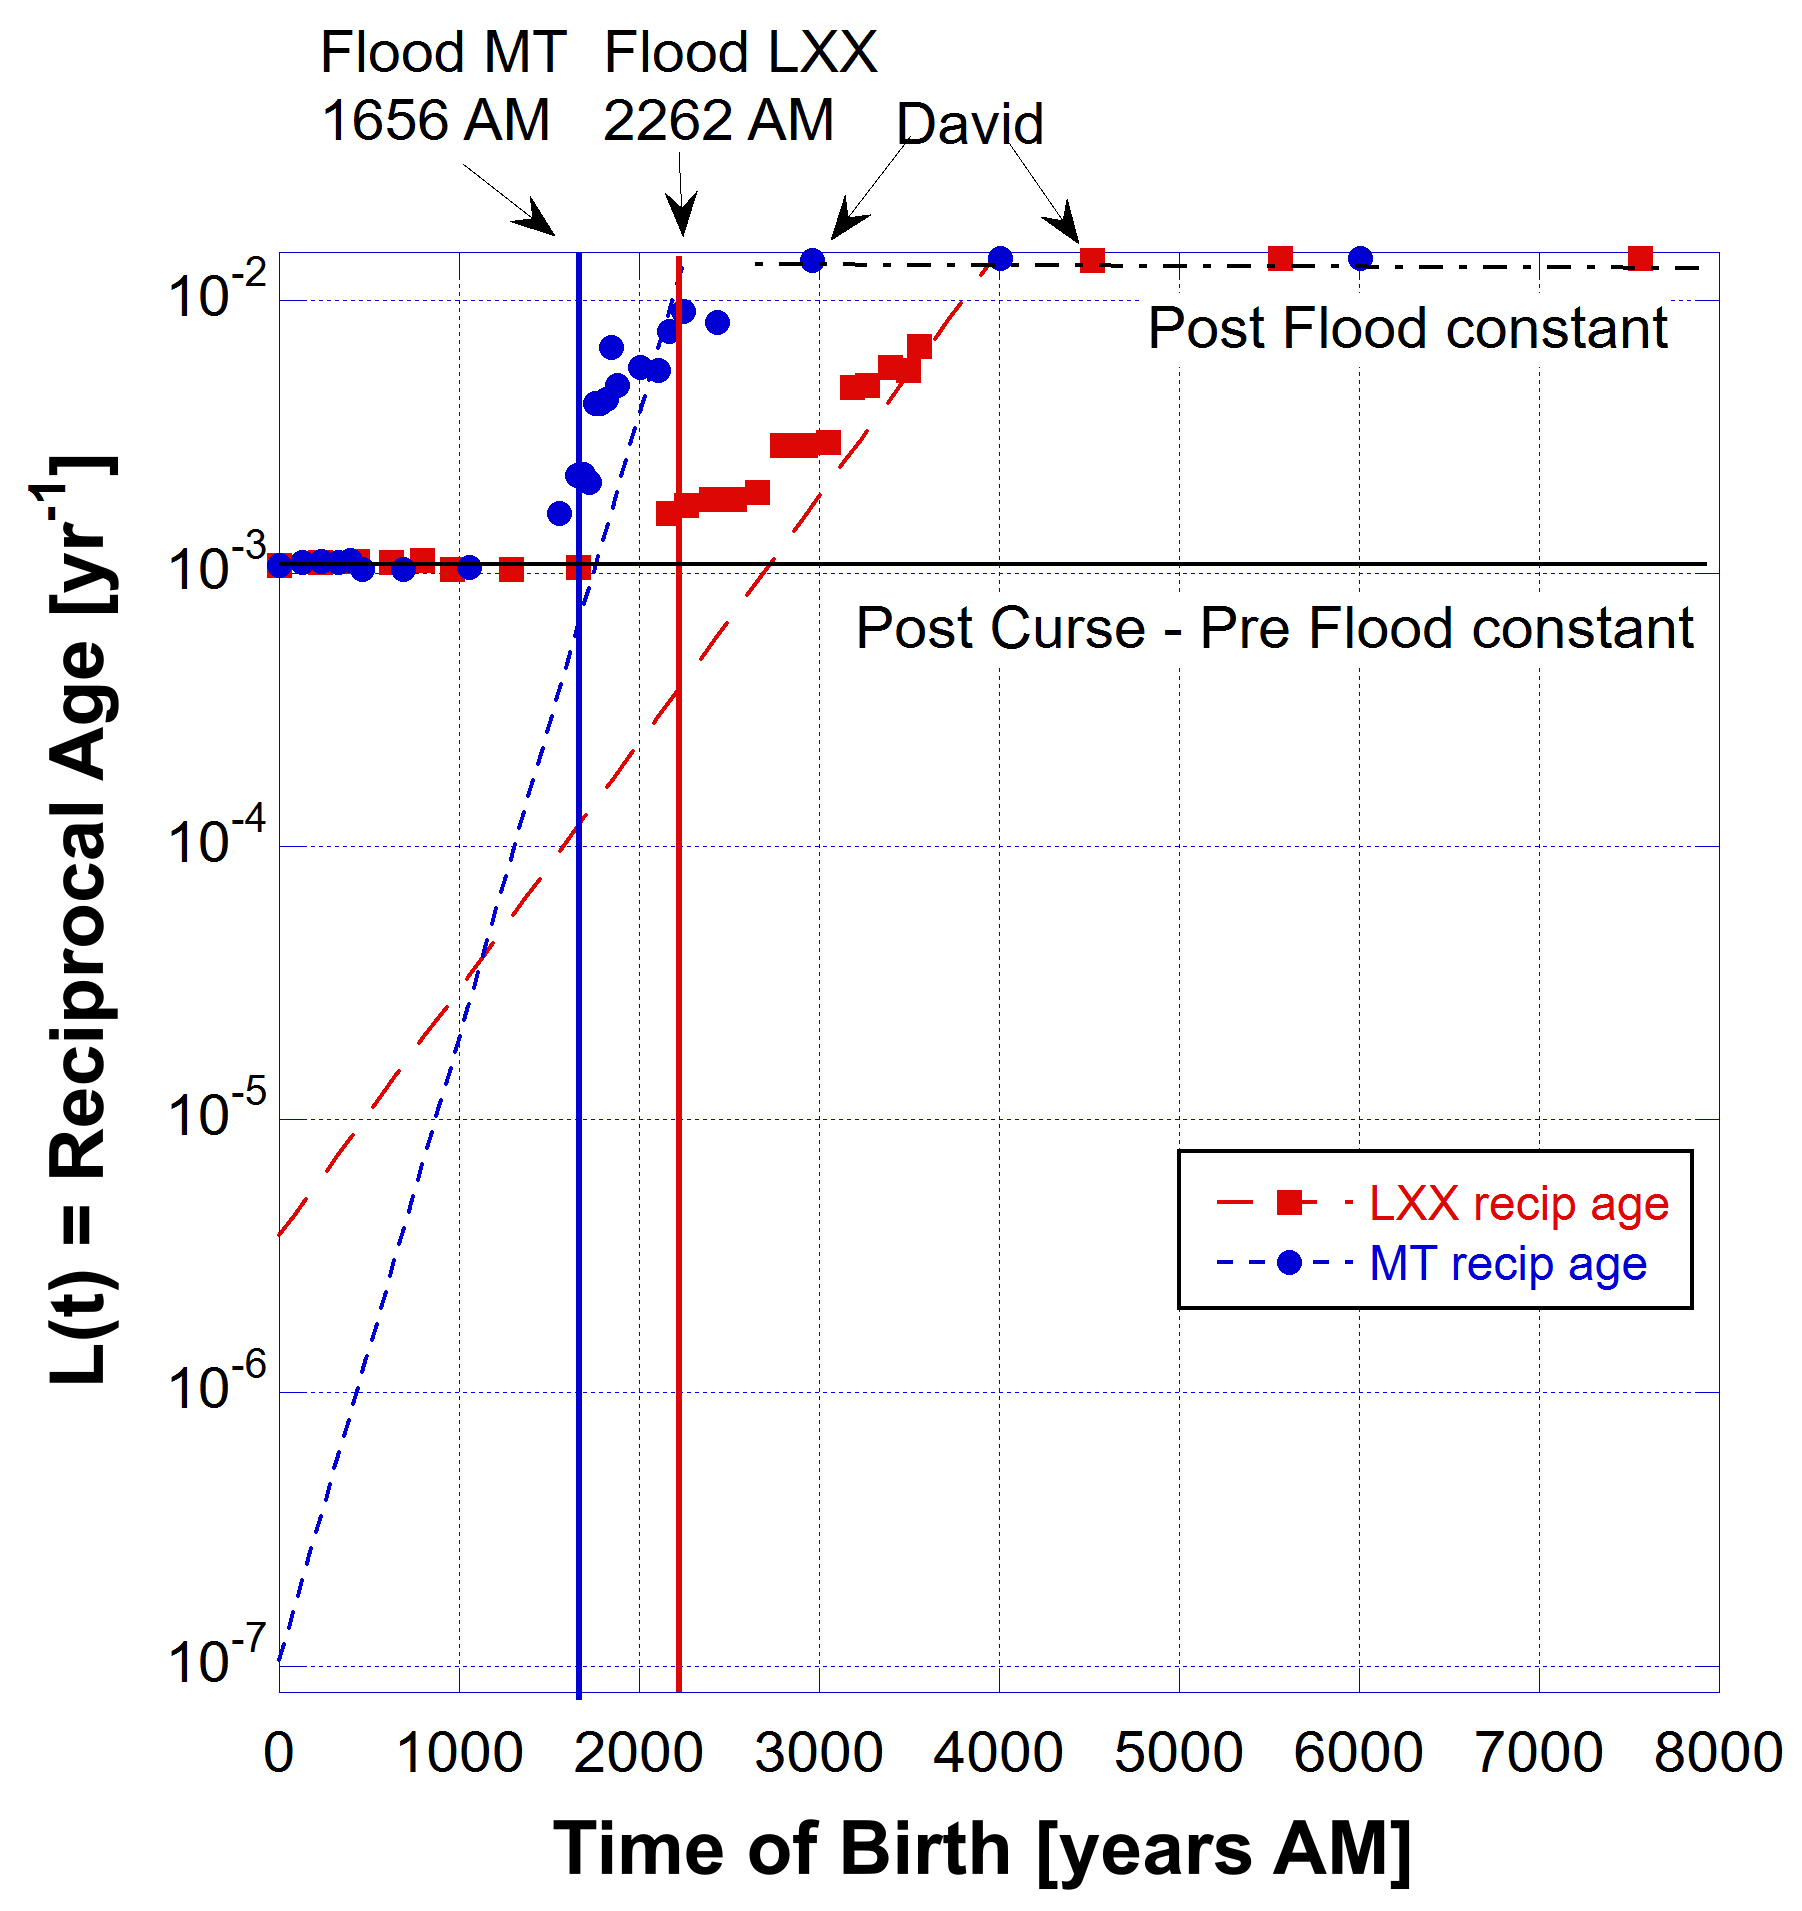
A high quality factor (Q-factor) or high resilience means low losses, that is, low reciprocal age. In Fig. 3 we have the reciprocal age L(t) for the patriarchs from both MT and LXX data. In this figure the time base is Anno Mundi [AM], years from Creation. Here the smooth dashed curves are merely a guide to the eye.

The approach I used to characterise the losses L(t) in this new model is different to the approach I took previously. Though qualitatively the result is the same, this approach yields some new insights.

I define a piecewise equation that describes the losses L(t) as follows:
L(t < t0) = A + B.exp(t/τ) [yrs-1], (2a)
where τ is a characteristic time constant determined from the exponential fit to either the MT or LXX data. In Fig. 4 the blue and red dashed curves are the Eq. (2a) fits to the MT and LXX data respectively. See Table below for fit parameters.
The time t0 is the time after which the sustaining power of God brings the losses L(t) to a new constant value equal to the reciprocal of 70 years. That time t0 depends on the data used. In both cases though
L(t ≥ t0) = 0.014286 [yrs-1]. (2b)
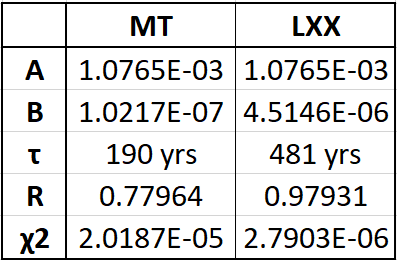
Using this model it is evident from the Residual (R) and Chi_squared (χ2) values that the exponential curve fit of Eq. (2a) is much better for the LXX data than for the MT data. The fit parameters R = 1 and χ2 = 0 when you have a perfect fit. For LXX data R = 0.9793 is much closer to unity than with the MT data. And the χ2 value is an order of magnitude smaller.
As time t tends to zero, i.e. at Creation,
L(t = 0) = A + B ≈ A = 0.0010765 (a constant),
because B << A.
The reciprocal of A is therefore the mean age before the Flood. In Fig. 4 I have labelled that as the Post Curse – Pre Flood constant. This is the value of the physiological resilience before the Flood. It was held constant by the Creator.
Before the Curse the value of A may have been zero. At that time the curve fits indicate, from the intercept points on the vertical axis, losses L(t = 0) of B = 1.1E-7 (MT) or 4.5E-6 (LXX). The reciprocals of those numbers are respectively about 10 million and 200,000 years. This model does not take the losses to absolutely zero, however the 2nd Law was in operation from the end of Creation week.
Discussion
Before the Curse Adam and Eve lived in the Garden in a state where the 2nd Law of Thermodynamics was operating but the losses were constantly being cancelled by a regenerating sustaining force of God. See the values of the dashed curves L(t) at time t = 0, the time of Creation.
After the Curse God withdrew a little of His sustaining power and maintained that level up to the Flood. That means some small constant losses were maintained as an effect of the Curse. Losses indicated by the black line labelled Post Curse – Pre Flood. Hence approximately constant ages were in range 900 – 970 years. Those lifespans then were an effect of the Curse reduced from at least 200,000 years (as they might have been without the Curse).
From Fig. 5 it is apparent that the process that led to the decline in longevity around the time of the Flood and after it, in fact, began at the Curse shortly after Creation. So it is a case of a predetermined outcome. God knew what would happen and He set the loss of resilience L(t) in motion right from near the beginning.
If we choose the red dashed L(t) loss curve based on the LXX in Fig. 5, Adam could have lived for 200,000 years but that was reduced to 930 years by God imposing the constant losses at the level of the Post Curse – Pre Flood constant shown. Because of the higher level of constant losses the underlying exponential increase could not be seen until the exponential curve broke above the level of the Post Curse – Pre Flood constant.
This is significant as it tells us that the Curse, not the Flood, was the main cause of the rapid loss in longevity. That is one insight that this new model provides.
In my previous model the functional form of the exponential did not fit well to the LXX reciprocal age data. The modelled loss curve fitted best to MT data, however when I added more MT data, to extend its range, the quality of the fit reduced.
With this new model the exponential loss of physiological resilience is fastest in MT data as it was with the previous model. But that may be no surprise because the MT timeline is compressed by 1,550 years compared to the LXX timeline. The Eq. (2a) curve fit though is much worse with the MT data (extended with new points) than with the LXX data as indicated by the fit parameters.
Therefore based on the underlying cause associated with the functional form of the model in Eq. (2a) the LXX patriarch age data is deemed to be more accurate. The MT age data therefore is more likely to be corrupted as suggested by various scholars including Henry B. Smith Snr from where most of the data I used is derived. Another example is found here.
In both models curve fits give the same value of the Post Curse – Pre Flood average age = 930 ± 10 years. Those ages were maintained by the sustaining power of God and then near the time of the Flood that sustaining power holding back the loss of energy and increase of entropy was released allowing the losses to increase according to the exponential curve (straight dashed line in Fig. 5) and rapid aging resulted.
On Figs 3-5 I have indicated the year of the Flood from the MT and LXX texts. The exponential growth in resilience continued well after the Flood as seen in both data sets. So the processes causing those losses continued well after the Flood.
But around the time of King David ages stabilised to about 70 years which means the losses of energy and decreased resilience in the human body stabilised to that value as determined by senile death currently. God must have switched off the exponential increase in losses via His sustaining power and imposed constant losses at the level shown by the dot-dash horizontal line labelled “Post Flood constant”.
I realised just now that there is one more piece of important information we can get from this analysis. If we extend the plots of L(t) losses well beyond the 70 year Post Flood age limit we get as shown in Fig. 6 below.
The red dashed curve of the losses derived from the LXX data is extrapolated according to Eq. (2a) to the current time as determined by the LXX timeline, that is, around 7580 years AM, i.e. after Creation. The value of the losses L(t = 7580) is approximately 1/26 th of a year. That means the loss of resilience has brought the human age down to 2 weeks only. If I had used the blue dashed curve derived from the MT data the losses L(t = 6030) would be 5 orders of magnitude greater at the current time, implying human ages of about 12 seconds.
So we can interpret this as meaning that God’s sustainment has limited the exponential growth in resilience losses to the level of the Post Flood constant, which is equivalent to about an age of 70 years, and for some perhaps as high as 100 years.

Whatever the causes of the post Curse exponential increase in the loss of organism resilience, it has been there since the Curse and it is only God’s sustainment that is restoring the ongoing damage so that human do live to ages longer than a few weeks.
Recent experimental evidence has shown that a stable magnetic field is beneficial to extend the ages of roundworms and mice.
“Ageing is co-regulated by genetic and environmental factors. Life on earth lives and evolves in a mild geomagnetic field. Yet, the biological effects of a moderate magnetic field on ageing and the underlying genetic mechanisms remain barely unknown. Here, we report that a moderate static magnetic field (SMF) extends the lifespan of [roundworm] Caenorhabditis elegans, a well-established model organism in ageing research. Consistently, the SMF-treated worms show improved motility and mitochondrial function when aged.”
Song, M., Dong, S., Zhang, X. et al. A moderate static magnetic field promotes C. elegans longevity through cytochrome P450s. Scientific Report 12, 16108 (2022). doi.org/10.1038/s41598-022-20647-0
“Therefore, our data show that the 1.7-year quasi-uniform static magnetic field (SMF) exposure can improve both the lifespan and healthspan of naturally aged mice due to reduced oxidative stress, which indicates that SMFs have the potential to be used as an adjuvant physical therapy to reduce the ageing-induced health risks to benefit animals, and even humans.”
Yixiang Fan et al., Life on Magnet: Long-Term Exposure of Moderate Static Magnetic Fields on the Lifespan and Healthspan of Mice, Antioxidants (Basel). 2022 Dec 31;12(1):108. doi.org/10.3390/antiox12010108
This fact might be a clue to an important environmental cause, the static magnetic field of the planet from the time of Creation to some 1,000 years after the Flood.
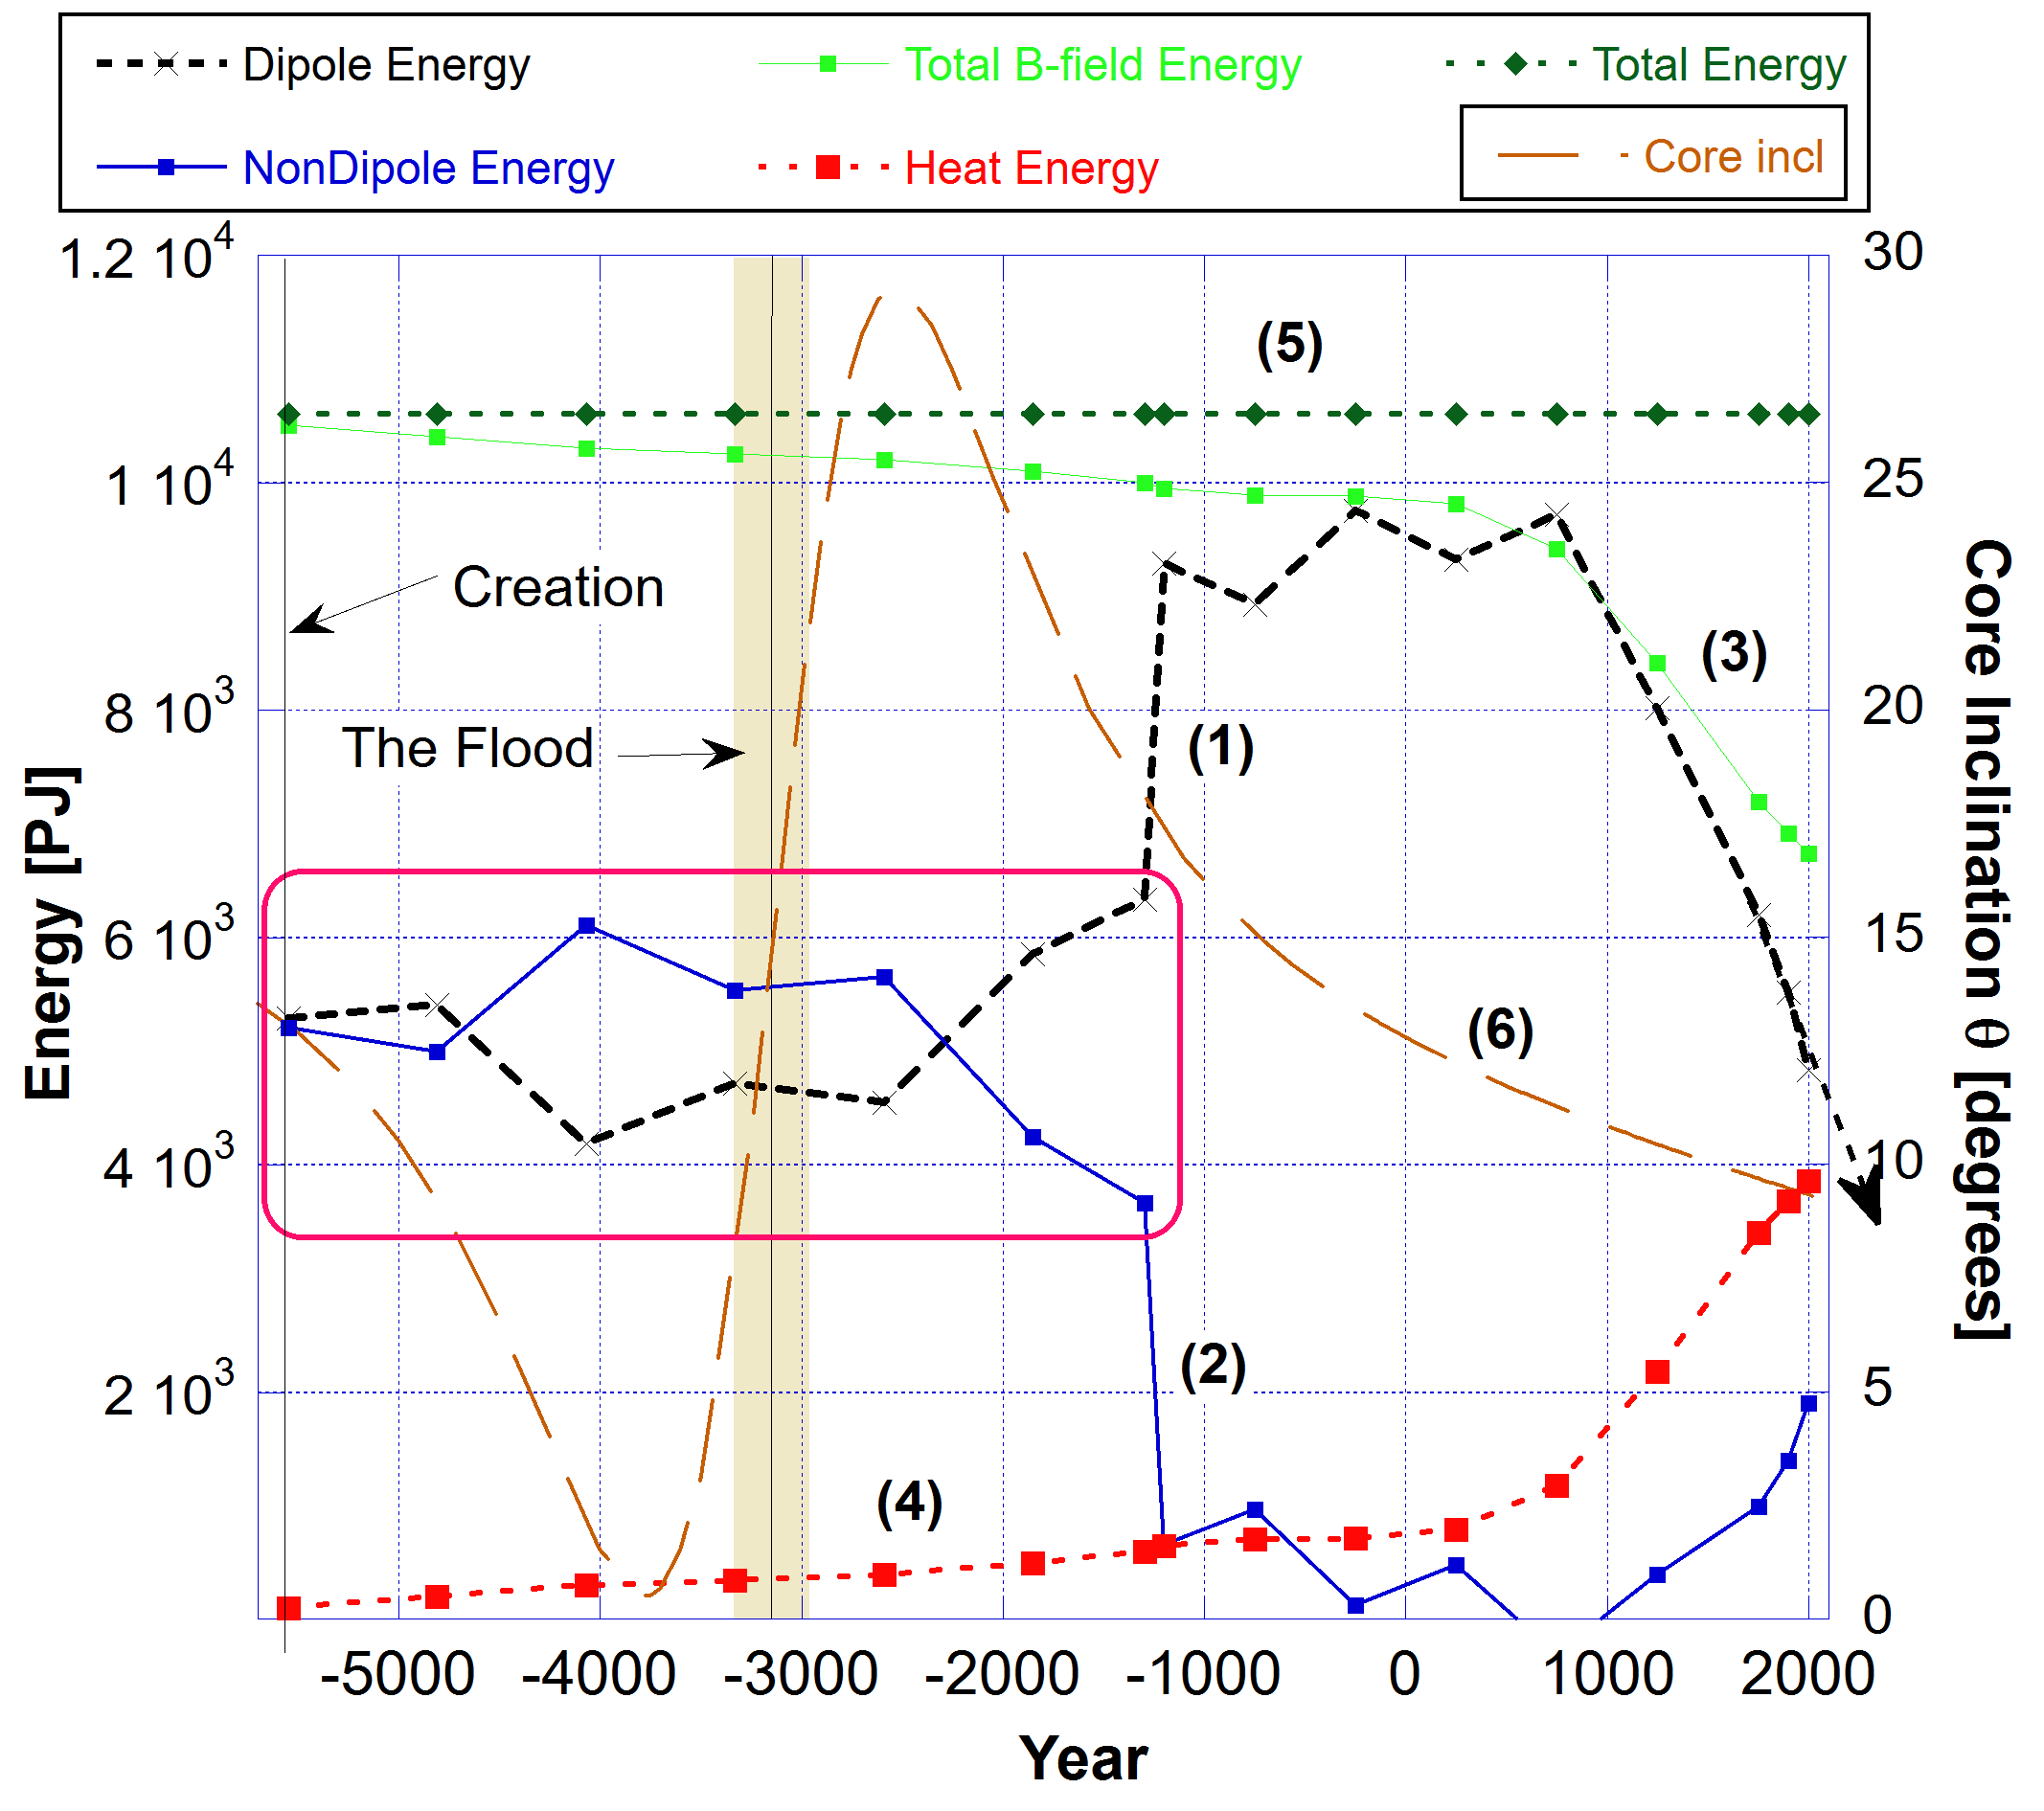
My modelling of the history of Earth’s magnetic field shows that it was essentially constant up to about 1,000 years after the Flood. Then there was a strong increase in the Dipole field strength and a concomitant decrease in the non-Dipole energy. This meant instability and rapid changes in the B-field finally resulting in a decay in total energy. The key figure is reproduced below. See A Brief History of the Earth’s Magnetic Field for a full explanation.
Conclusion
Very long lifespans were a feature of the created world but since the times of the pre-Flood patriarchs the underlying physical properties (including physiological resilience) for such long ages have been eviscerated. The underlying exponentially increasing all-cause mechanism of loss began at the Curse with a very low level which was initially masked by the constant level of losses up to the Flood.
All organisms are running out of energy and loss of physiological resilience effects of the 2nd Law have had a major impact. The Arrow of Time is defined by 2nd Law; entropy always increases. The loss of genomic information since Creation has been unrelenting; entropy always increases. Decay of telomeres and other biological factors also may be involved. Destabilisation of the Earth’s magnetic field may have contributed to loss of resilience, but it appears that the cumulative effect from all causes, in fact, began soon after Creation at the Curse. It was “baked in” from Creation.
There is no going back to the pre-Flood state and to lifespans of order 930 years. Even if humans were able to reach their maximum age potential now of 150 years as indicated by recent research, when their physiological resilience goes to zero at death, that indicates a hard limit where the losses L(t) are limited to a value greater than 0.007 [yrs-1], half the Post Flood constant value I used here. It cannot be much less like it was in the past.
That loss limit was imposed by the Creator against the exponential growth that started at the Curse, and if it had been allowed to grow beyond the Post Flood constant limit it would have destabilised the organism and no life could exist.
The Post Flood limit means that no human can achieve ages exceeding 150 years. I suspect that even that is extremely optimistic. More likely the limit is set around 120 years. See this video.
Only with the coming of the Lord Jesus Christ and His renovation of the human body can long lifespans – eternal lifespans – be achieved.
Related Reading
- Beyond Death | Taxation and an Absolute Limit to Human Lifespan
- Human Lifespans | What Can the Ages of the Patriarchs Tells Us?
The Good News – the Gospel
- Do You Know Him?
- The Salvific Power of Christ
- How Do You Know You Are Saved?
- Can You Do Anything To Be Saved?
Free Subscribers
Subscribe to our Newsletters as a Free Subscriber and be notified by email. Just put your email address in the box at the bottom of your screen.
You’ll get an email each time we publish a new article. It is quick and easy to do and totally free. You only need do it once.
Premium Subscribers
Subscribe to our Newsletters as a Premium Subscribers at $5 USD/month or $30 USD/year (you choose). Cancel anytime.
Paid Premium Subscribers will get exclusive access to certain content I publish. That will only cost you a cup of coffee per month.
Also you’ll be able to download, for free, a PDF of my book Apocalypse Now and also a PDF of my book The Physics of Creation The Creator’s Ultimate Design for Earth.
You can download them from the link below.
This is how you can support my work. I have been publishing this website for 10 years now and up to 2024 I never asked for any support.
Press the button “Premium” on the front page to find a list of Premium content. Thanks so much to all supporters.
At a minimum, please join as a Free Subscriber. It’ll cost you nothing. It may also help me beat the shadow banning of some posts.


Leave a comment