
With all the fireworks in the last 6 months I decided to update my charts, which I last did about a year ago, showing the performance of the prices of gold and silver compared to their expected prices based only on real dollar devaluation due to the US Federal Reserve expansion of the money supply (M2) and also due to the US Consumer Price Index (CPI). The latter we should all know is a big fat lie. The charts below certainly highlights that fact.
For an Introduction to these charts see the following:
- Arcadia Silver Report | How High are Gold and Silver Prices Going?
- World War III | Gold and Silver Prices Will Also Explode
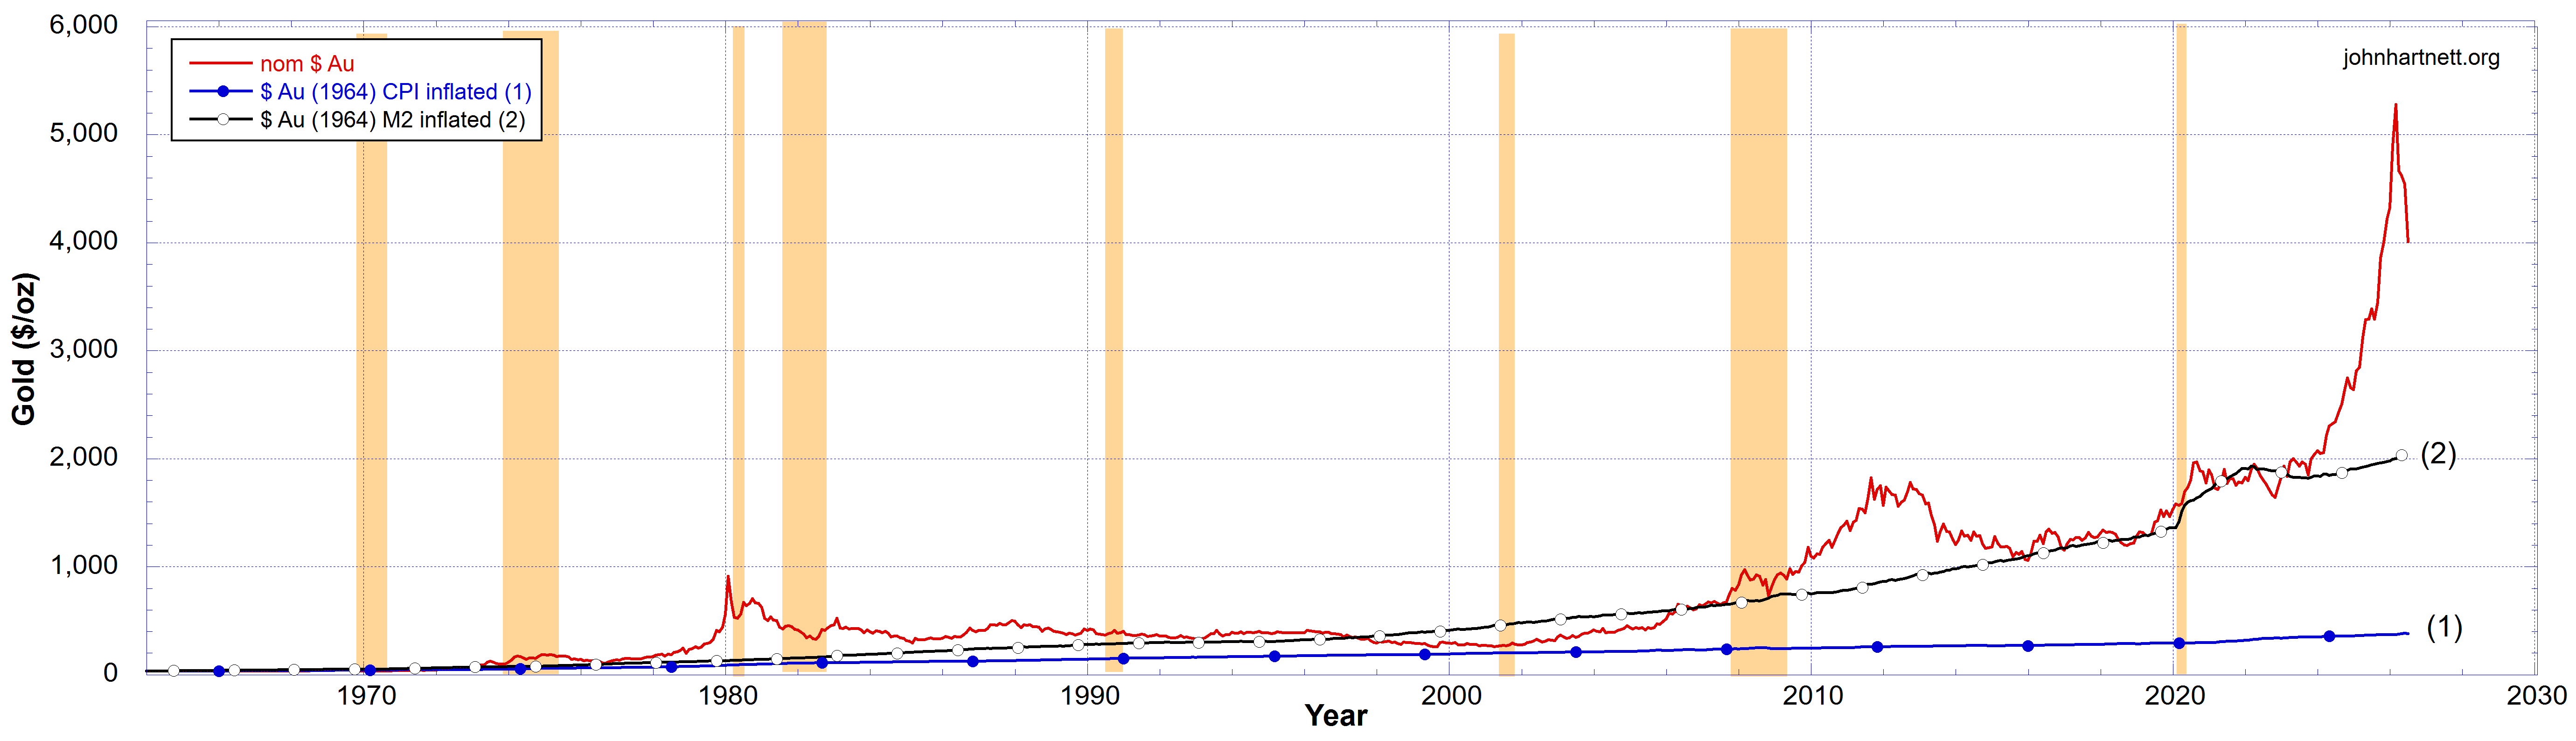
Charts 1 and 2 extend the trends over another year compared to my previous pieces on this.
The price of gold remains well above the inflated price expectations from both the M2 currency supply expansion and the CPI. The CPI is a manipulated index, which this chart shows is really a joke.
The M2 inflated price expectation more closely matches the actual price of gold but from July 2025 there was a very strong break out. Only in January 2026 did we see a very big correction to the almost vertically increasing prices at that time.
Governments love to use the CPI lie because they look better on the economy. But the truth is that massive credit creation, “money printing”, by the Fed and other nations central banks, is the true cause of price inflation.
Note in charts 2 and 3, in the period 2020 to 2025, a correlation between the prices of gold and silver with price inflation calculated from the M2 currency supply. But only a very weak signal is seen in the corresponding period in the CPI.
So, for gold, there is still a massive difference between the actual price and the price expected due to the liberal expansion of the M2 currency supply. But the same cannot be said for silver.
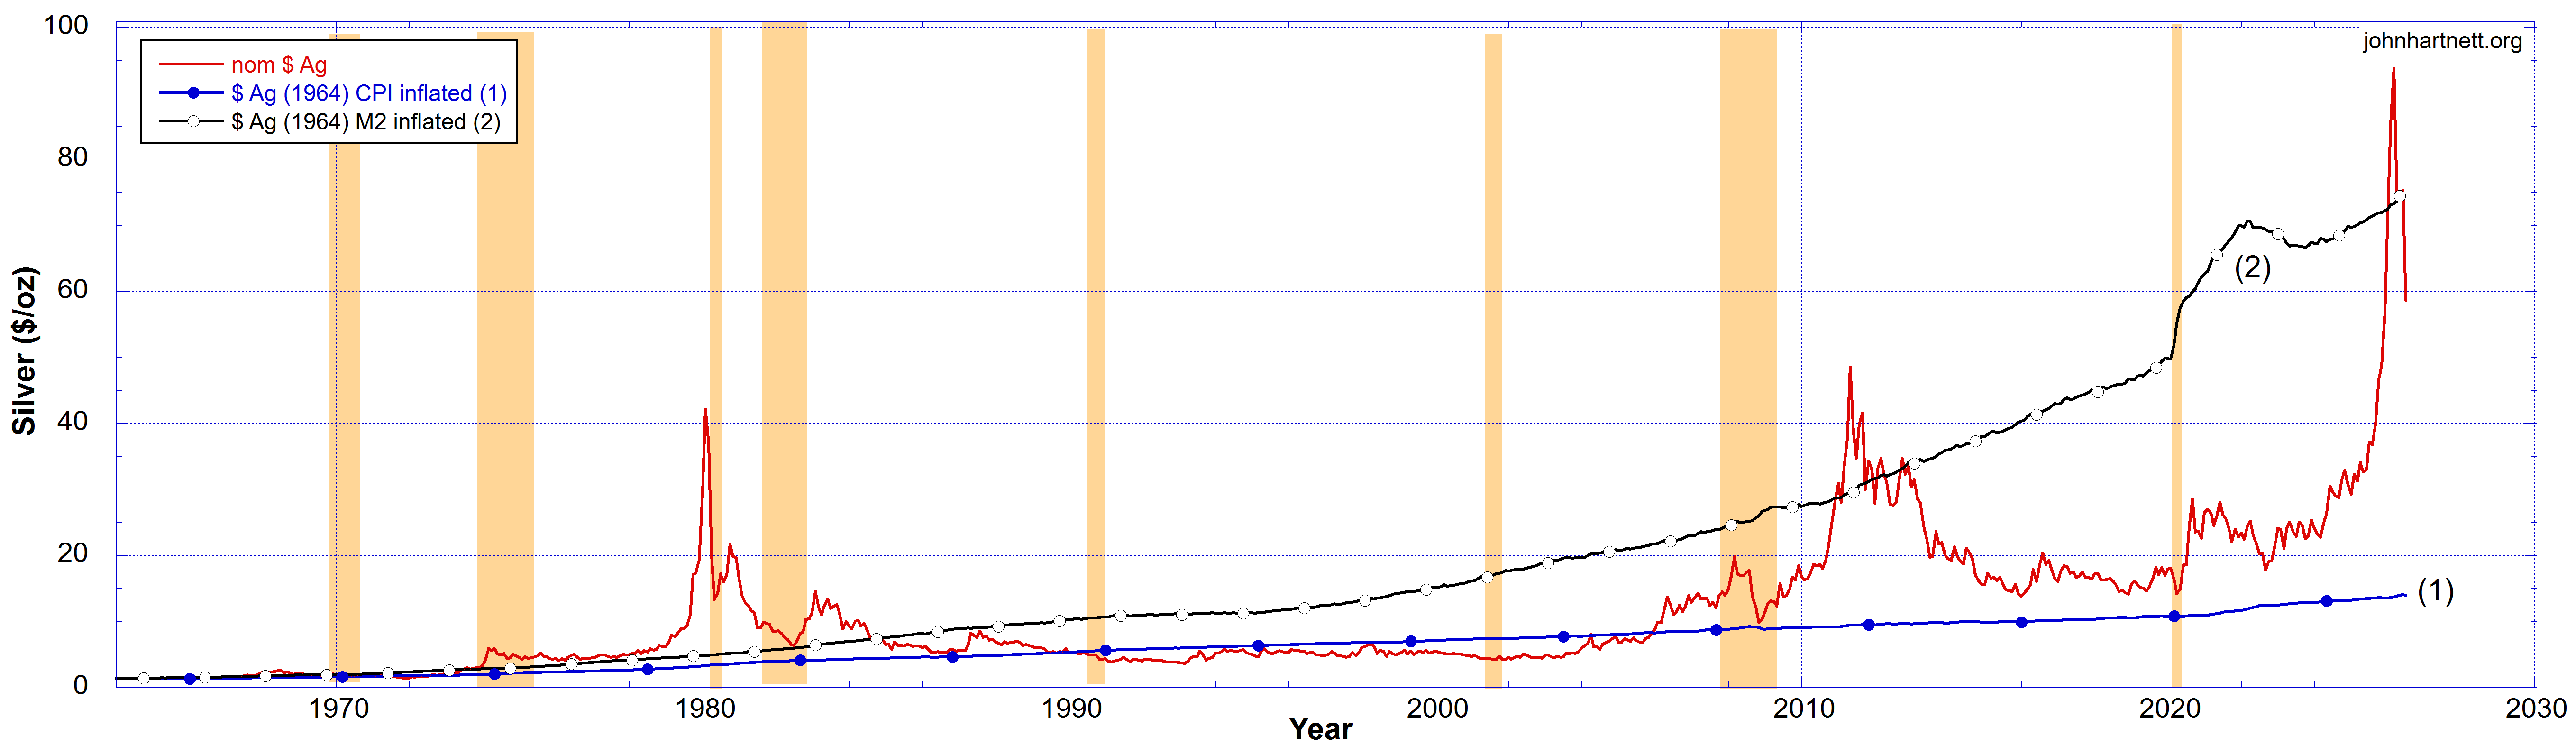
Before June 2025 silver was significantly undervalued and underpriced. The massive rally up to January 2026 priced it more correctly when it passed $74/oz. But it didn’t stay up there very long. By March 2026 the price of silver had fallen to $74 which is where it should be according to inflation from expansion of the M2 currency supply. M2 data lags several months so we cannot see beyond that yet. But quite obviously credit creation continues and the black curve (2), representing silver’s expected price, will continue upward. This means that silver at the moment is again undervalued and cheap.
The following two charts show whether the value of these metals are fair value and for how long they have been in the past 52 years.
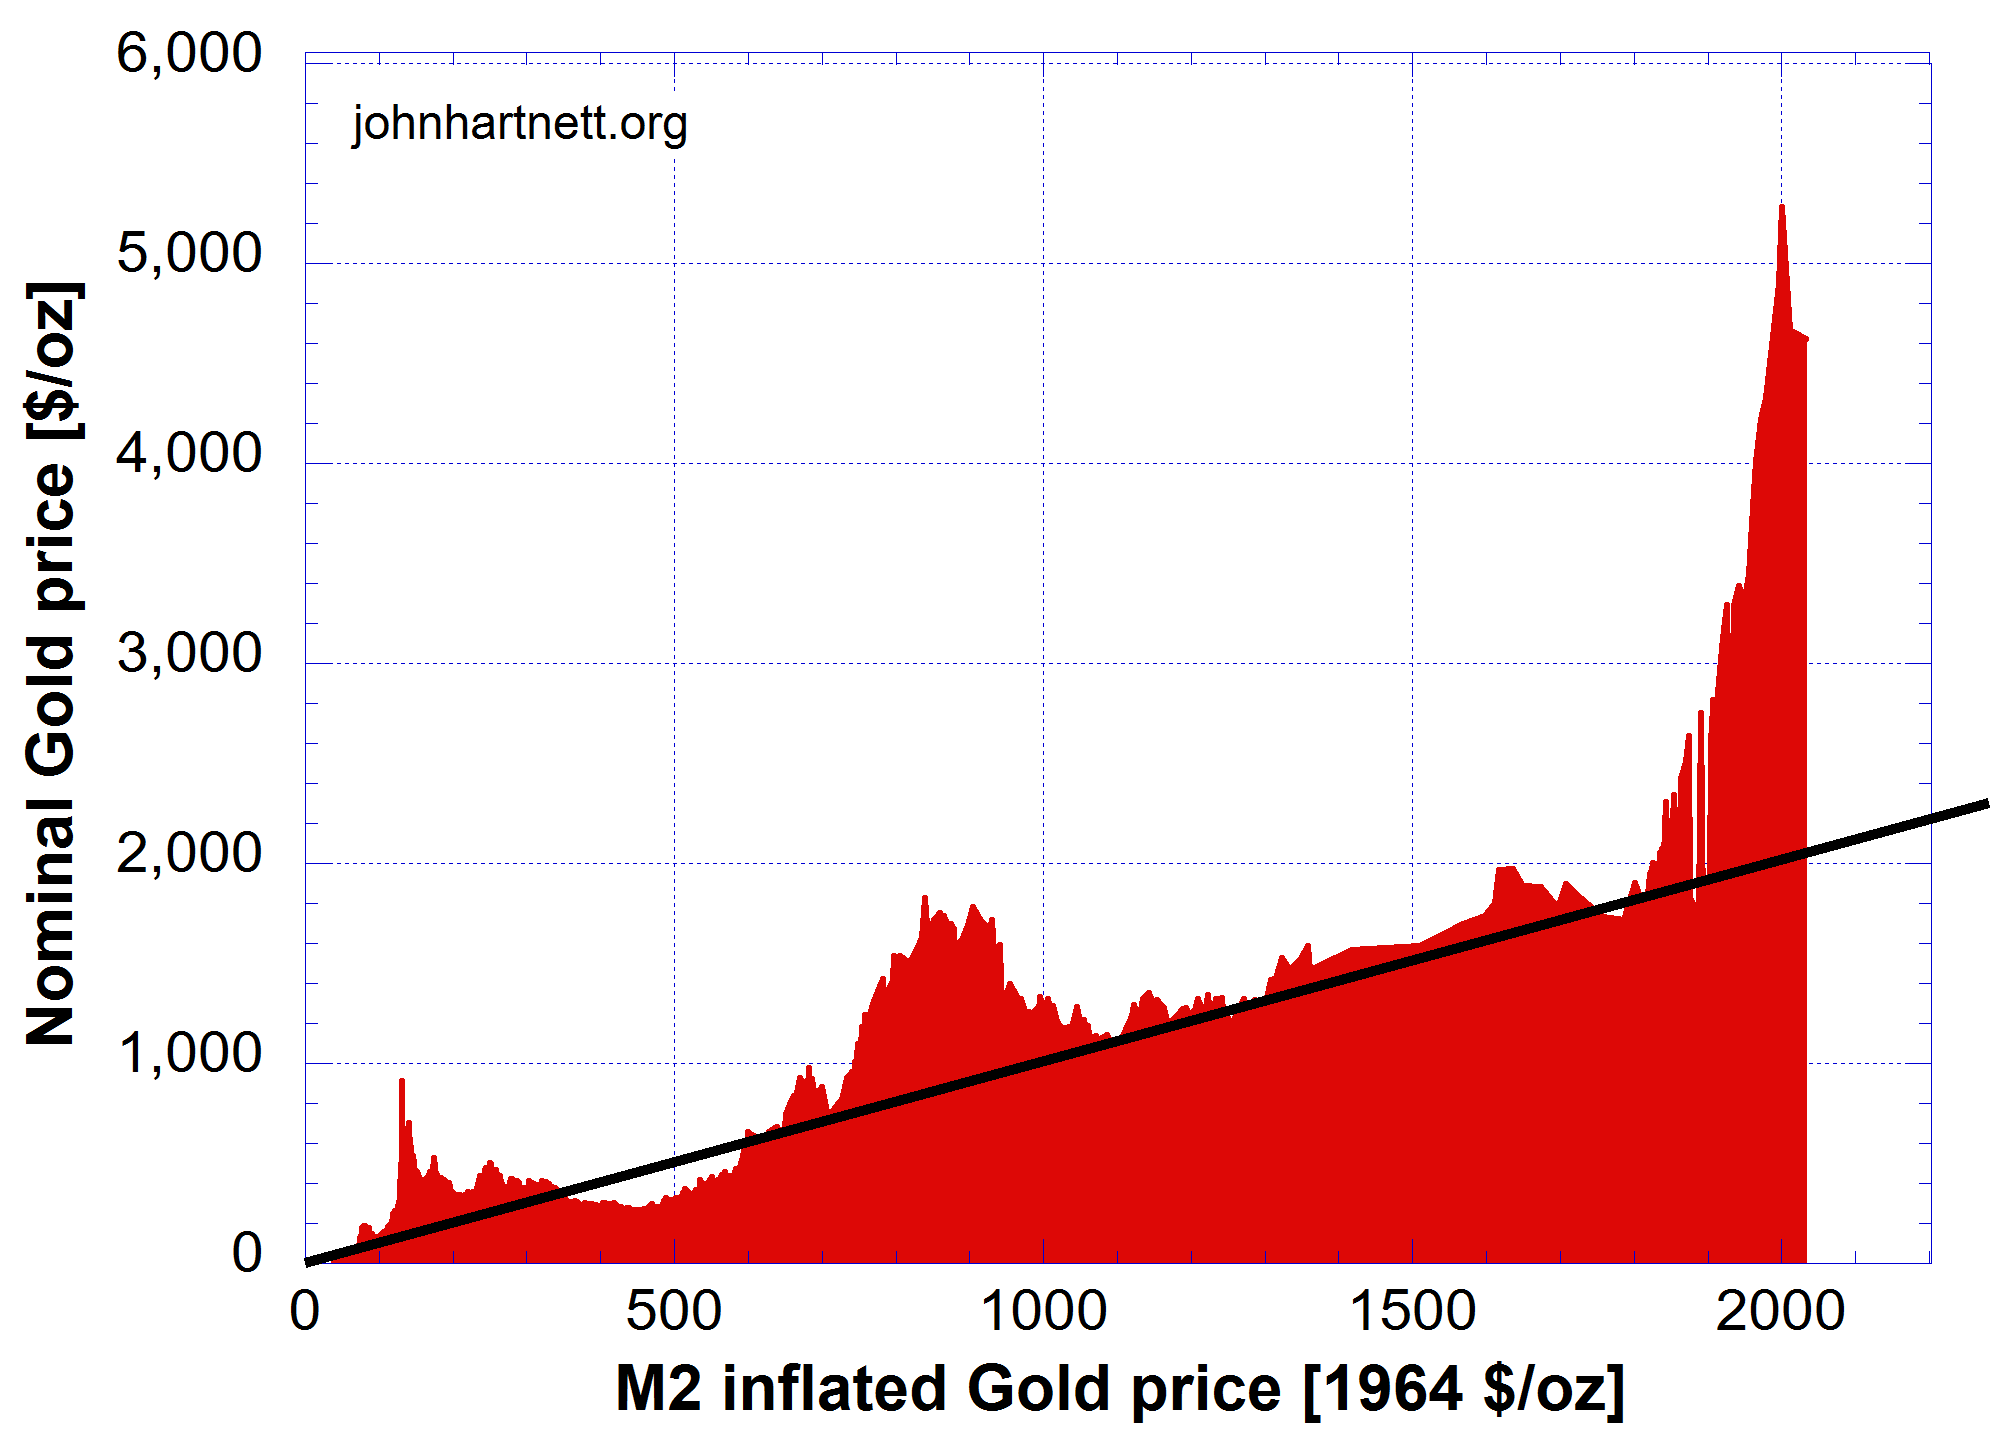
Chart 3 tells us that except for a brief period when its price was below $500 gold has been priced at fair value for most of the time since 1964. When the prices have been above the solid black diagonal line they represented fair value, which has been most of the time.
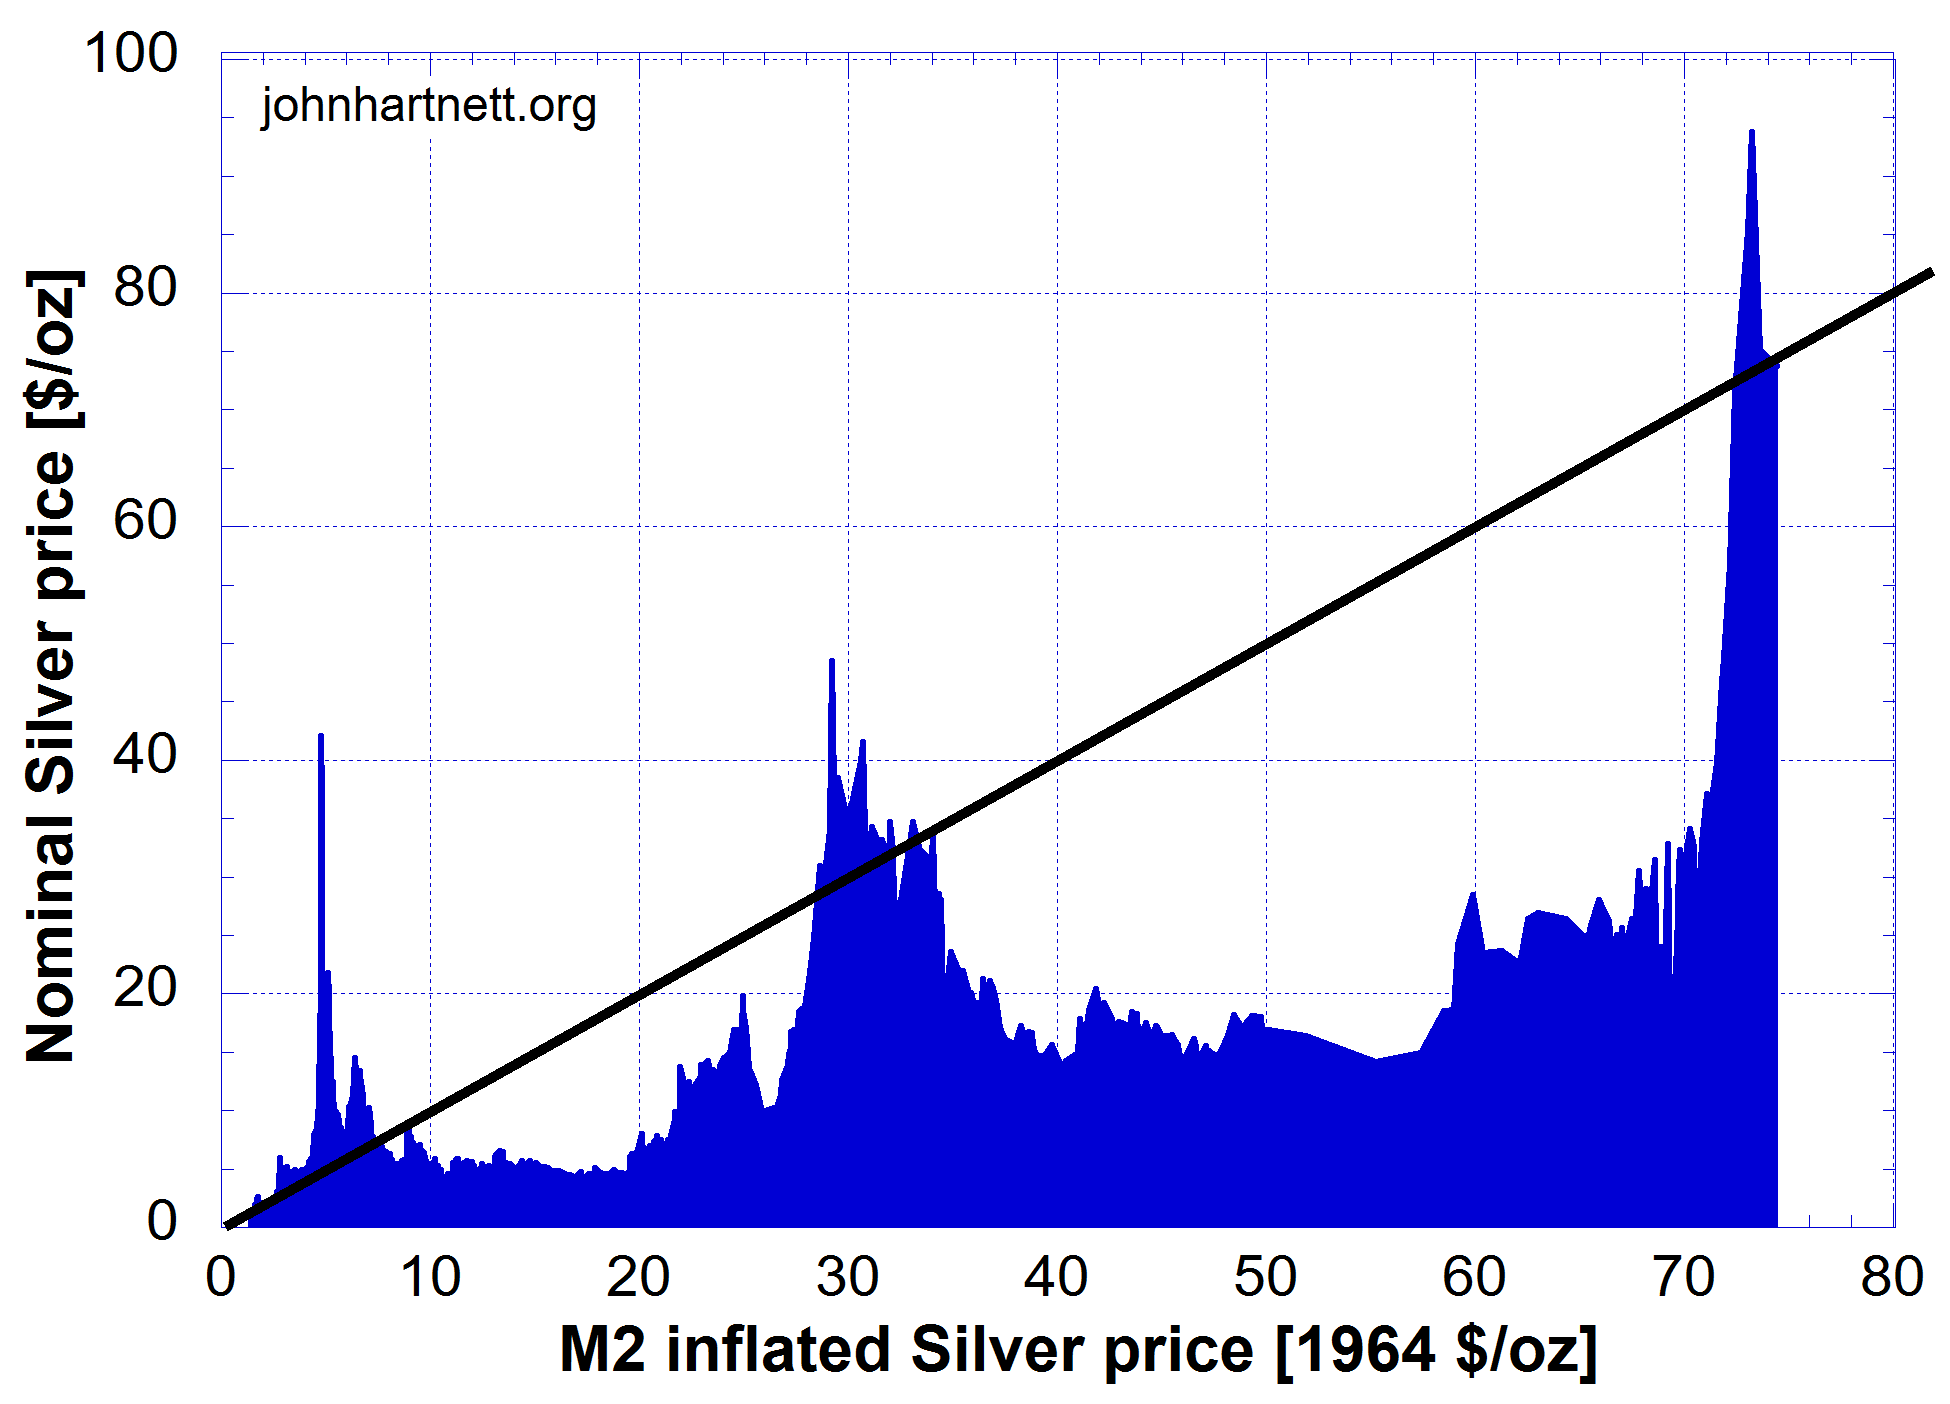
However, for silver it is a very different picture. Chart 4 tells us that the silver price must have been suppressed for a very long time. It tells us that silver has been priced at fair value only three times since 1964. Those fair value prices were when the price peaked above the solid black diagonal line.
In March 2026 silver’s actual price equalled M2 inflated price, which is fair value, but since then its actual price has fallen. I don’t have the data for a M2 calculation after that yet, so it is not shown on chart 4 above.
I don’t take risky bets on the stock market but I do have some small positions in gold and silver miners. Those equities perform pretty similarly to the gold and silver prices, which is not unexpected.
The reason I wanted to do these calculations above was because of the massive correction in gold and silver prices since January 2026. I wanted to see where I now stand and what might be expected in the future.
Gold and the miners still seem to be pretty solid investments. Silver remains highly volatile. So my personal conclusion is, and if I had any money, I’d be buying both metals.
As Rick Rule says the best time to buy is when people hate a commodity the most, and sentiment right now for gold and silver is at an all-time-low. Silver may be a good buy at this time, especially if its nominal price continues to fall. But I suspect it may have bottomed and is going to start rising very soon.
Related Reading
- Why World War III?
- Wake Up World! World War III Has Begun!
- World War III Has Begun (at Least Against the Currency)
- War – Boom – Bust | What’s Next? The Digital Prison
- All Wars Are Banksters’ Wars
- Australia: CPI Inflation Fraud
Free Subscribers
Subscribe to our Newsletters as a Free Subscriber and be notified by email. Just put your email address in the box at the bottom of your screen.
You’ll get an email each time we publish a new
Premium Subscribers
Subscribe to our Newsletters as a Premium Subscribers at $5 USD/month or $30 USD/year (you choose). Cancel anytime.
Paid Premium Subscribers will get exclusive access to certain content I publish. That will only cost you a cup of coffee per month.
Also you’ll be able to download, for free, a PDF of my book Apocalypse Now and also a PDF of my book The Physics of Creation The Creator’s Ultimate Design for Earth.
You can download them from the link below.
This is how you can support my work. I have been publishing this website for 10 years now and up to 2024 I never asked for any support.
Press the button “Premium” on the front page to find a list of Premium content. Thanks so much to all supporters.
At a minimum, please join as a Free Subscriber. It’ll cost you nothing. It may also help me beat the shadow banning of some posts.






Leave a Reply